Choosing Tire Pressure using Static Contact Patch Measurements

Setting tire pressures is one of the simplest modifications used to tune vehicle handling. Because the tire is the source of force/moment generation, it directly impacts vehicle handling.
Choosing tire pressures is subject to great controversy. Some drivers stick with manufacturer recommendations; however, the high tire pressures on modern vehicles have conflicting goals with track use, namely rolling resistance. Some drivers choose a known good value based on experience, but find it difficult to explain their decisions. Handling problems are confounded with tire pressure selection causing many drivers to worsen vehicle handling or leave grip on the table, reducing the performance potential of their vehicle.
At Apex Performance Engineering, we face the same challenge. We have our own recommendations, but they are based on subjective experience without good empirical evidence. To guide our decision, we look at tire footprints at several inflation pressures to understand how the contact patch shape changes.
Due to the unique nature of every vehicle and tire construction, this is not general advice. The tire pressures for your car may be very different. The advice presented here is intended for off-road use. We recommend following manufacturer specifications when driving on public roads.
Under Pressure
Tire inflation pressure affects the structural properties of the tire, and therefore changes the way tire forces and moments are generated. Under-inflating the tire risks compromising its structural integrity, causing the sidewalls to ‘fold over’ or cause damage to the tire. Over-inflating the tire reduces the contact patch size, relying on a small contact area for force/moment generation.
In a design of experiments of front and rear tire pressures, we found the driver preferred hot tire pressures set at 28 psi. This was the lowest inflation pressure in the experiment. We have since followed these findings and assumed 28 psi as the target hot tire pressure.
While the relationship between the contact patch shape and tire force/moment characteristics is not very well understood (at least by us!), we assume there is some correlation that proves useful. We will verify any trends with on-track testing before we make conclusive recommendations.
Tire Footprints
Static tire footprints are taken with a Bridgestone Potenza RE-71R 255/40R17 on the Apex Performance Engineering #991 2000 Honda Civic Hatchback. With the tire covered in ink, the vehicle is set on to a sheet of paper to obtain the tire footprint. We use weigh scales to ensure that the vertical load is the same between tire footprints. Six tire footprints were obtained at pressures between 24 psi and 34 psi.
The tire footprints are digitized on to a computer for analysis. After some image filtering and post processing, we get a binary image representing the tire footprint.
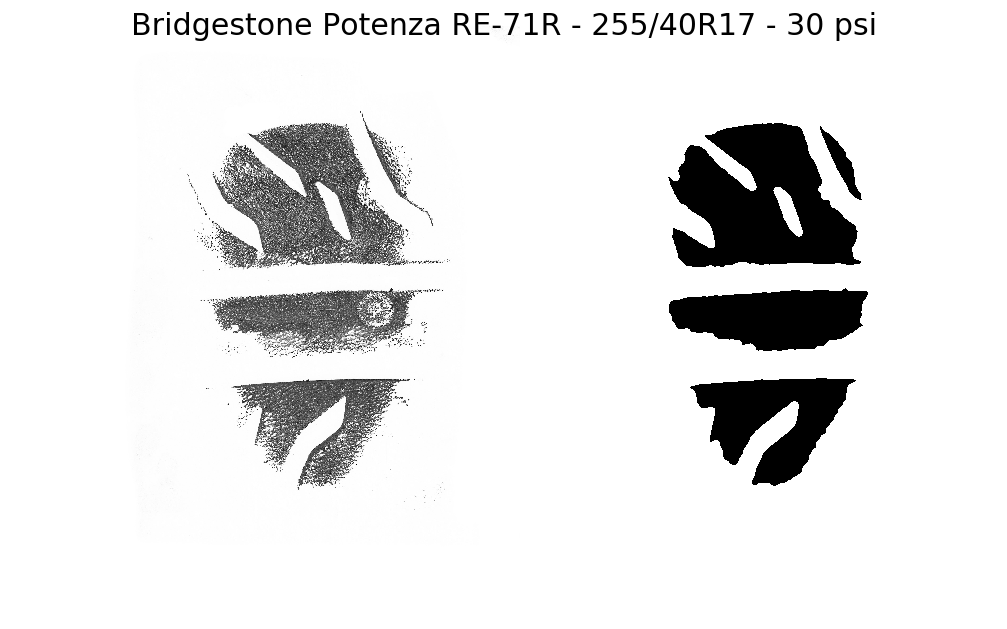
This is a similar technique used by research laboratories and is subject to ASTM standard F870. While we are not a research lab, we can definitely apply the same ideas (on a budget) to get interesting results!
Analysis
To gain an appreciation of the size and shape of the tire footprint, lets compare all of them together in one image. The images have been centred around the geometric centroid to provide consistent comparison between inflation pressures. The outline surrounding the footprint is the contact patch shape obtained from post-processing.
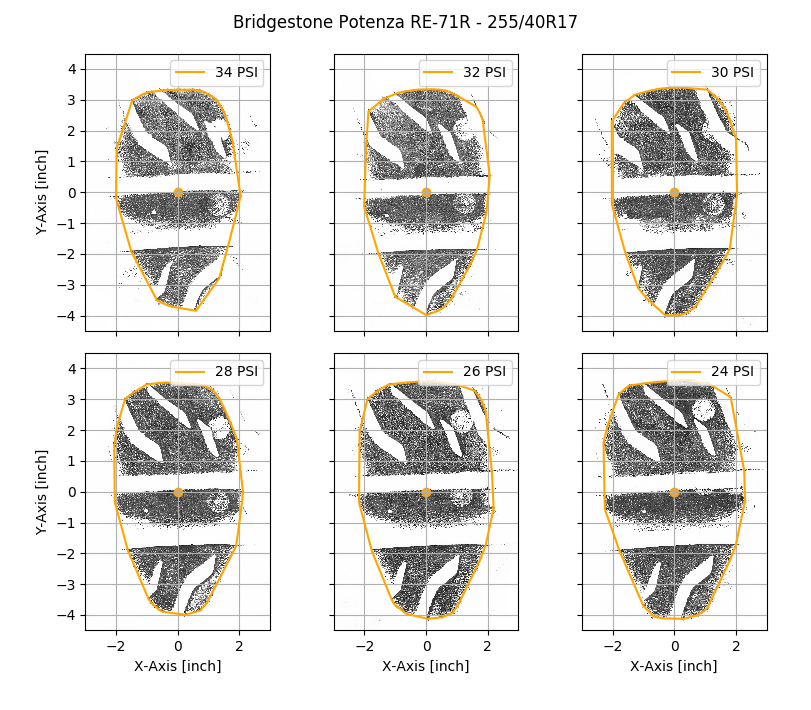
Just by visual inspection, you can see that inflation pressure affects the size of the contact patch. If you pay close attention, you can see the footprint expands in both length and width as pressure is decreased. The centroid does not move much between the different inflation pressures.
To gain a quantitative measure of these changes, we can use image processing techniques to extract metrics like length, width and contact area. In our analysis, contact area is the gross area encircled by contact patch outline.
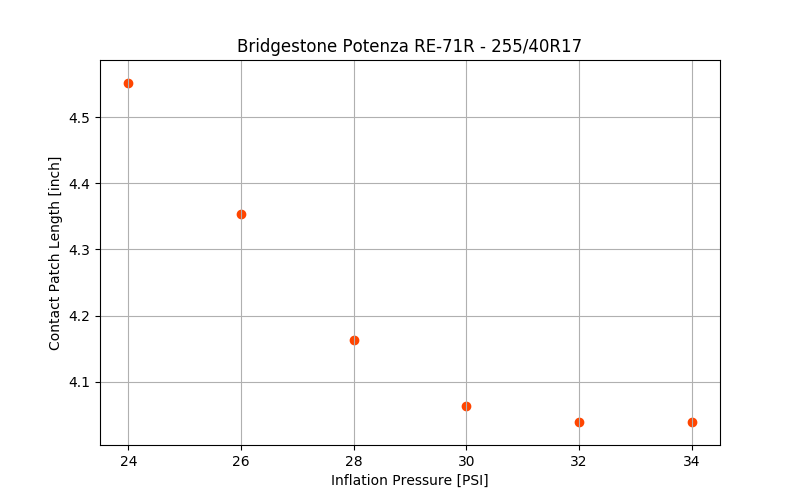
The contact patch length decreases as inflation pressure increases, but saturates at 32 psi. The contact patch length stays the same (4.05 inches) above this pressure. This trend is correlated with our subjective testing experience, with the driver being more sensitive to inflation pressures below 30 psi and less sensitive to changes in inflation pressure above 30 psi.
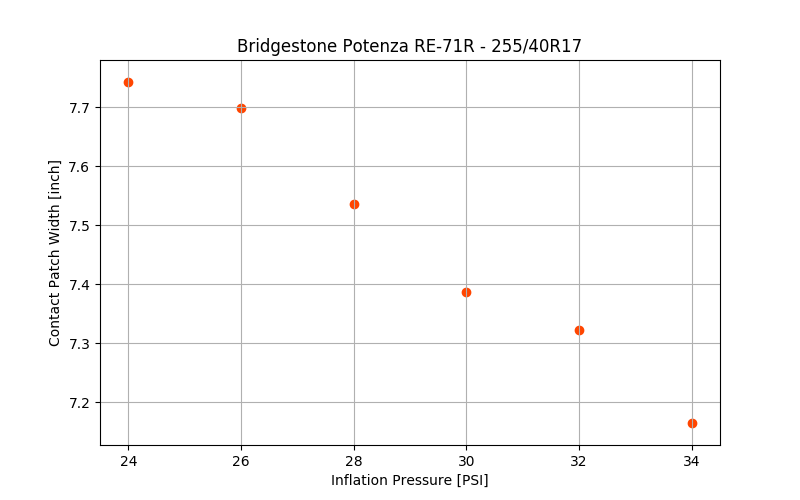
The contact patch width decreases as inflation pressure increases. The contact patch width looks like it saturates below 24 psi; however, not enough data is present to make this conclusion.
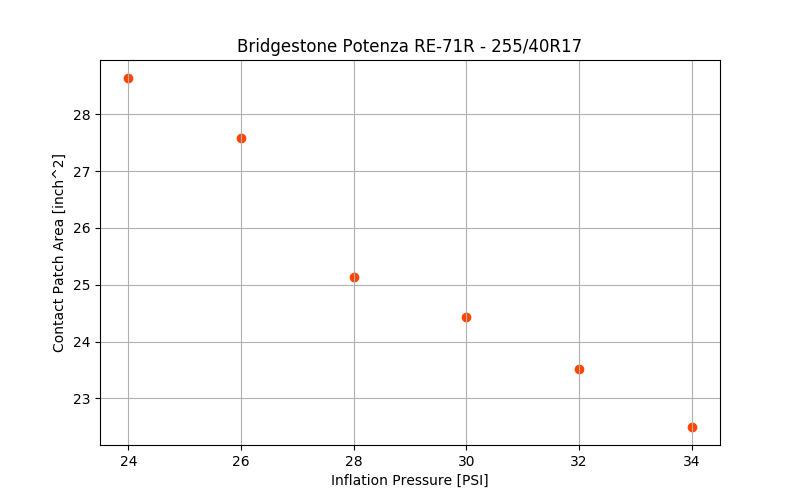
The contact patch area decreases as inflation pressure increases. This relationship appears to be linearly correlated with pressure. The outlier at 28 psi is due to the contact patch shape detection missing an outer ‘rib’, reducing the computed contact patch area.
Findings
Our internal recommendation has been to set a hot inflation pressure of 28 psi. While this is a reasonable recommendation, the analysis shows that we can increase the contact patch area by decreasing the inflation pressure below 28 psi.
Contact patch length shows the greatest sensitivity near 26 psi, and becomes insensitive to inflation pressure changes near 32 psi. Race strategy will influence your decision of tire inflation pressure. Choosing tire pressures near 26 psi may yield more grip due to the increased contact patch length and area, but will be more susceptible to handling variation caused by thermally induced pressure changes. In time attack where maximum grip is necessary, this could be a risk worth taking!
In short, our findings show the #991 2000 Honda Civic Hatchback with 255/40R17 Bridgestone Potenza RE-71R tires have a wide working range of pressures going as low as 24 psi. Our previous assumption likely means we are overinflating the tires. We can increase the tire contact area by reducing the tire pressure by 2 psi or more. This will be tested using subjective driver evaluation and data acquisition to verify the findings.
Two major parameters are missing from this analysis: vertical load and inclination angle. This is a topic we hope to explore in the future!
Final Comments
Choosing the best tire pressures for your lapping day or autocross event is challenging. Static tire footprints are an easy, offline technique that can help you choose the best inflation pressure for your tire-vehicle combination. The simplicity of this method means it can be applied to any road vehicle.
Using tire footprints to analyze the static contact patch helps us understand the impact of tire inflation pressure. This technique allows us directly visualize its effect on the tire. Because tires are critical to the performance of your road vehicle, tire pressure selection is a major consideration.
The guiding principle at Apex Performance Engineering is to develop the car-driver system as a whole. Interested in how chassis setup can improve your driving? Send us a message on Facebook or Instagram!
Acknowledgements
I would like to acknowledge the following individuals for their contribution to this article:
- Ping Zhang at Apex Performance Engineering for loaning his time, race car and weigh scales used to obtain the tire footprints. Thanks for your collaboration and making this work possible!
- Gerald Nembhard at Stage Four Motorsports for his fantastic work prepping the car. The vehicle would not be ready for this experiment without his help!
References
- “Footprint.” Smithers Rapra. Accessed August 01, 2019. https://www.smithersrapra.com/testing-services/by-sector/automotive/tire-testing/footprint.
- Woodward, David, Phillip Millar, Chris Tierney, and Campbell Waddell. “The Static Contact Patch of Some Friction Measuring Devices,” n.d., 13.
- “ASTM F870 - 94(2016).” ASTM International - Standards Worldwide. Accessed August 01, 2019. https://www.astm.org/Standards/F870.htm.