Open Lapping with a Smartphone at Cayuga
There are several apps for your smartphone that can measure vehicle data and log outing information while you drive. Making the most of this information can be tricky; limited access to sensor data and low sampling rates obfuscates the details necessary for traditional data analysis techniques. Video overlays are great for making qualitative observations, but lack a quantitative aspect to quickly study trends.
Lets see how much information we can extract from just a smartphone app during an open lapping session.
Background
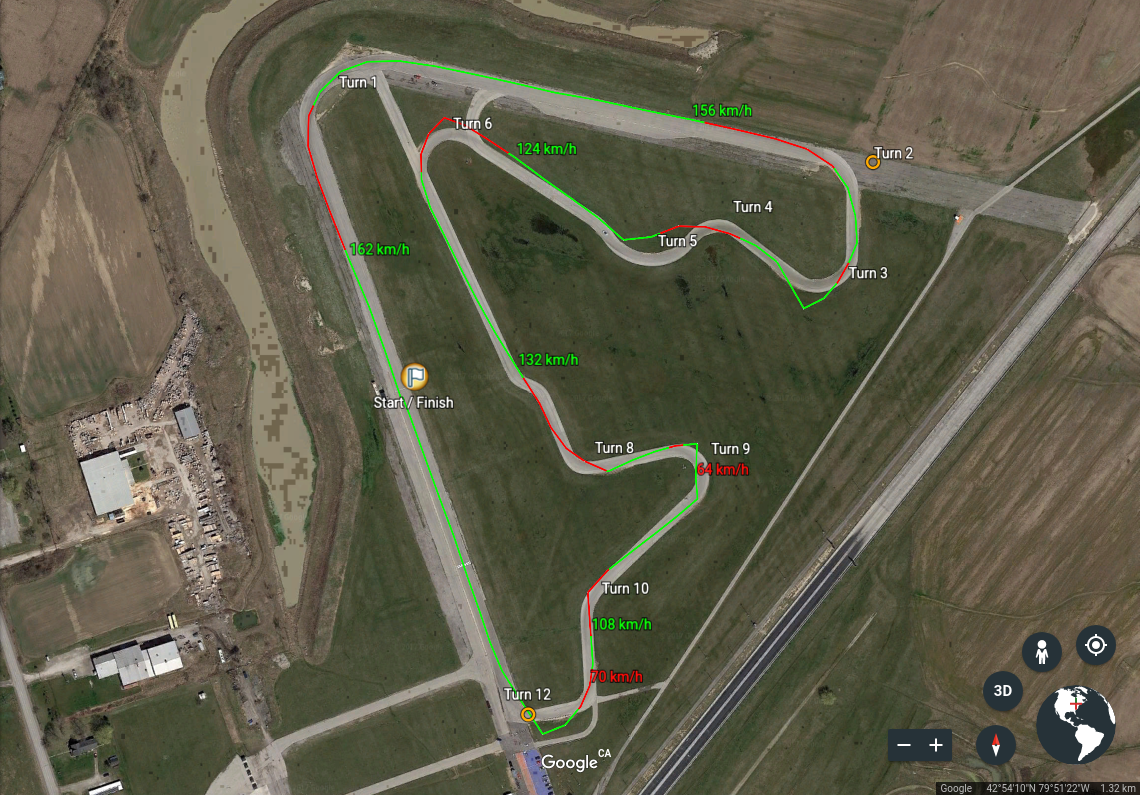
We will be using Harry’s Lap Timer for iPhone during our open lapping session. The phone is attached to a K20 swapped Honda EK Civic using a windshield cellphone mount.
We will be lapping at Toronto Motorsports Park in Cayuga, ON. This app can export a .KMZ file with some nice overlays you can view in an application like Google Earth.
We can also export all of our outing data as a CSV. The first CSV is a table with the lap times.
| LAPINDEX | DATE | TIME | LAPTIME | DISTANCE_KM | DISTANCE_MILE |
|---|---|---|---|---|---|
| 85 | 22-JUL-17 | 10:56:54.00 | 01:34.89 | 2.3219 | 1.442762 |
| 86 | 22-JUL-17 | 10:58:29.00 | 01:30.78 | 2.3348 | 1.450777 |
| 87 | 22-JUL-17 | 11:00:00.00 | 01:31.77 | 2.2981 | 1.427973 |
| 88 | 22-JUL-17 | 11:01:32.00 | 01:31.90 | 2.336 | 1.451523 |
| 89 | 22-JUL-17 | 11:03:03.00 | 01:28.66 | 2.3732 | 1.474638 |
| 90 | 22-JUL-17 | 11:04:32.00 | 01:34.50 | 2.3469 | 1.458296 |
| … | … | … | … | … | … |
The next file is a 1 Hz data stream of the GPS and accelerometer as measured by the smartphone.
| LAPINDEX | DATE | TIME | TIME_LAP | SPEED_KPH | DISTANCE_KM | LATERALG | LINEALG |
|---|---|---|---|---|---|---|---|
| 85 | 22-JUL-17 | 14:56:52.68 | 0 | 109 | 0 | -0.15 | 0.2 |
| 85 | 22-JUL-17 | 14:56:53.00 | 0.32 | 113.5 | 0.01 | -0.16 | 0.2 |
| 85 | 22-JUL-17 | 14:56:53.00 | 0.32 | 113.5 | 0.01 | -0.09 | 0.24 |
| 85 | 22-JUL-17 | 14:56:54.00 | 1.32 | 120.9 | 0.0436 | -0.16 | 0.2 |
| 85 | 22-JUL-17 | 14:56:55.00 | 2.32 | 127.9 | 0.0799 | -0.13 | 0.22 |
| 85 | 22-JUL-17 | 14:56:56.00 | 3.32 | 134.1 | 0.1174 | -0.18 | 0.17 |
| … | … | … | … | … | … | … | … |
Nothing fancy here. We used the phone as a standalone unit, meaning we do not have access to onboard vehicle data via the diagnostic port.
Software
There is no shortage of analysis tools available. Everything you see here is generated with Python using the following packages:
- Jupyter
- NumPy
- Pandas
- Matplotlib
Lap Time
Instead of using the fastest lap as the singular benchmark to evaluate the driver, we can look at the evolution of lap time over the course of the day. Laps have been coloured by their respective outing.

Speed
Vehicle speed is another good channel to look at since it is directly related to lap time. The vehicle speed in this scenario is provided by the GPS on the smartphone. Here we summarize the data in a box plot.

Lateral Acceleration
Lets dig a bit deeper and look at the accelerometer data. The 1 Hz data stream is too coarse to look at as a time series, so we again summarize the data with a box plot.

It be can difficult to interpret just the raw lateral acceleration values.
Taking the absolute value can help bring out any trends or patterns in the
data.

Longitudinal Acceleration
The longitudinal acceleration data can also be summarized in the same way as
the lateral acceleration data to reveal brake and drive performance.

Combined Acceleration
Putting both the lateral and longitudinal acceleration together shows the combined acceleration performance.

We can gate the data to select measurements when the longitudinal acceleration is less than zero. This would be indicative of the driver’s (or vehicle’s) ability to use the combined grip at corner entry.

GG Diagram
Moving to more traditional analysis techniques, a GG diagram can be generated with the lateral and longitudinal accelerometer data. Remember to calibrate your accelerometer before you head out!

Conclusion
Smartphone apps are a quick and easy way to start taking vehicle measurements during open lapping. These applications are not limited to just video overlays. With some patience, additional analysis can help you make objective measurements of your driving.
Special thanks to Ping Zhang for lending his driving skills and for providing all the data you see in this post.