Photography as data acquisition - measuring instantaneous chassis roll and tire inclination angles from a photo showing the rear profile of the EK20R
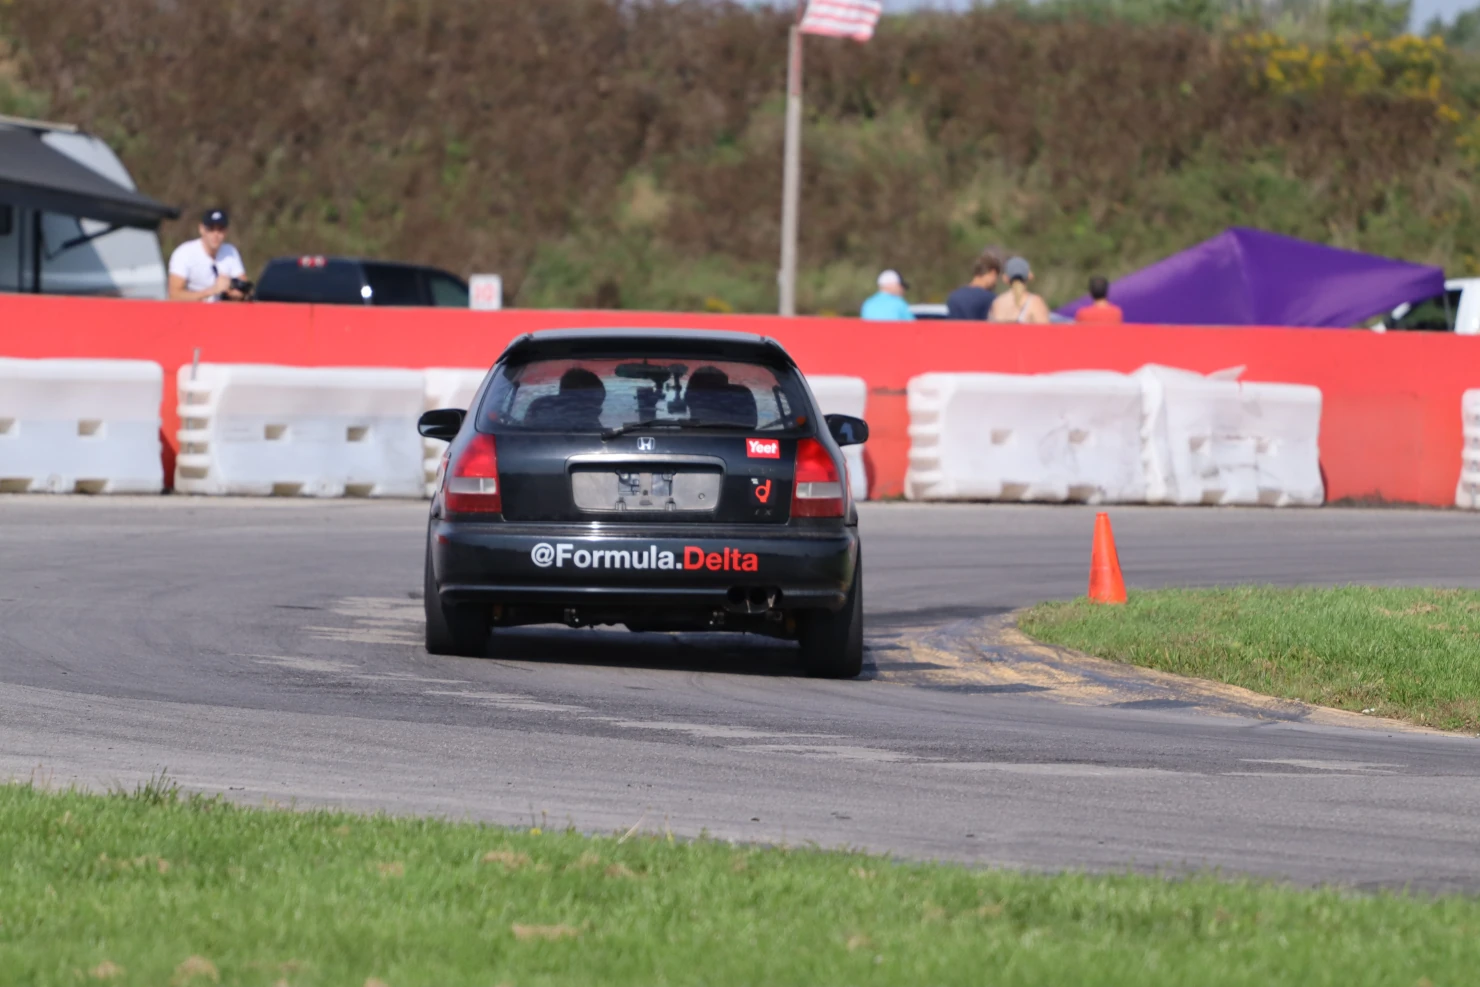
Vehicle data can come from surprising sources. During a lapping day at Toronto Motorsports Park - hosted by Speed Academy, The Straight Pipes and PhD Racing - we were lucky to have our friend Troy Cheron behind a camera to take this photo.
This photo is a surprise source of data. It near perfectly captures the rear profile of the vehicle at the apex of a turn. It also reveals some interesting phenomena in vehicle dynamics.
In this article, we show how a photograph can be used to measure aspects of the vehicle state during cornering for the purpose of developing setup on the Formula Delta EK20R.
Smile, you’re on camera
The image of interest shows the Formula Delta EK20R going around turn 12 at Toronto Motorsports Park. The photo was taken using a Canon EOS Rebel T8i with a Canon EF 70-200mm f/4L USM lens. The image is 24 megapixels and is compressed in JPEG format.
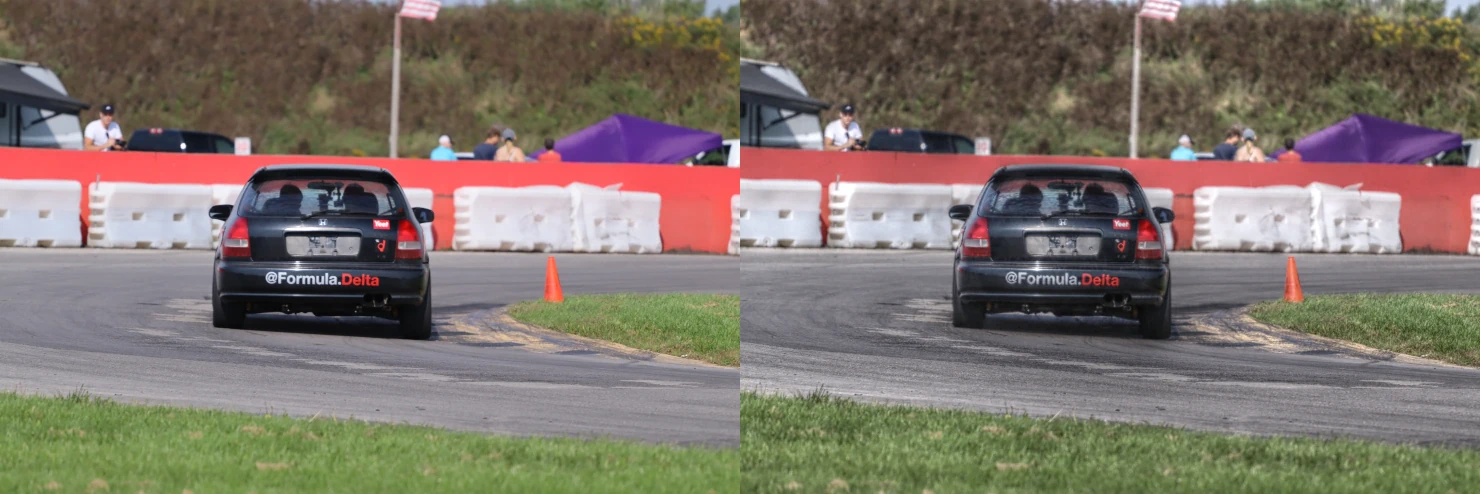
The image is processed with Mantiuk 2006 using GIMP 2.10.32. This is to reveal detail in the shadowy regions underneath the car. You can compare the original image and processed image in the figure below on the left and right respectively.
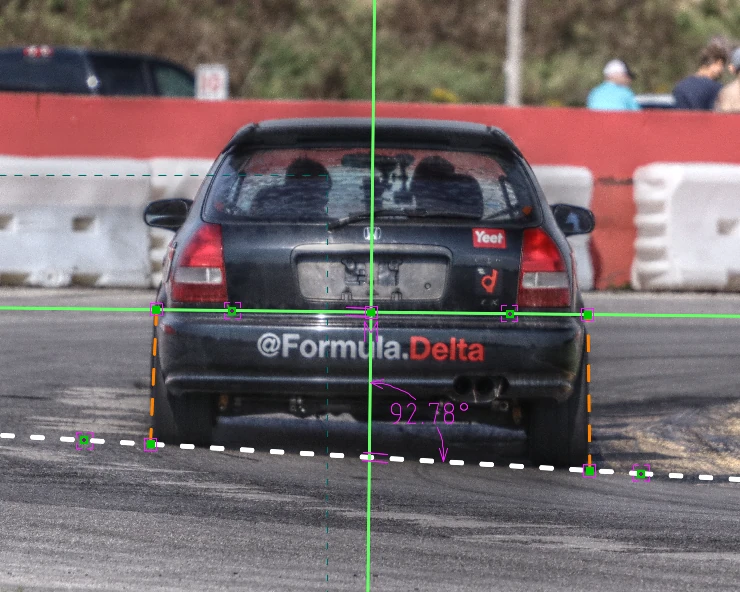
The processed image is imported into SolveSpace 3.1~70bde63c. SolveSpace is a free parametric 3D CAD tool. Within the SolveSpace CAD environment, the image is annotated with reference lines to represent lines of interest. The following line types are used in this analysis.
- Dashed white represents the intersection between the ground plane and the vertical plane of the rear axle
- Solid green represents the vertical and horizontal reference lines with respect to the chassis
- Dashed orange represents the outer wheel face of the rear wheels
The annotated image showing the different reference lines is shown in the figure below.
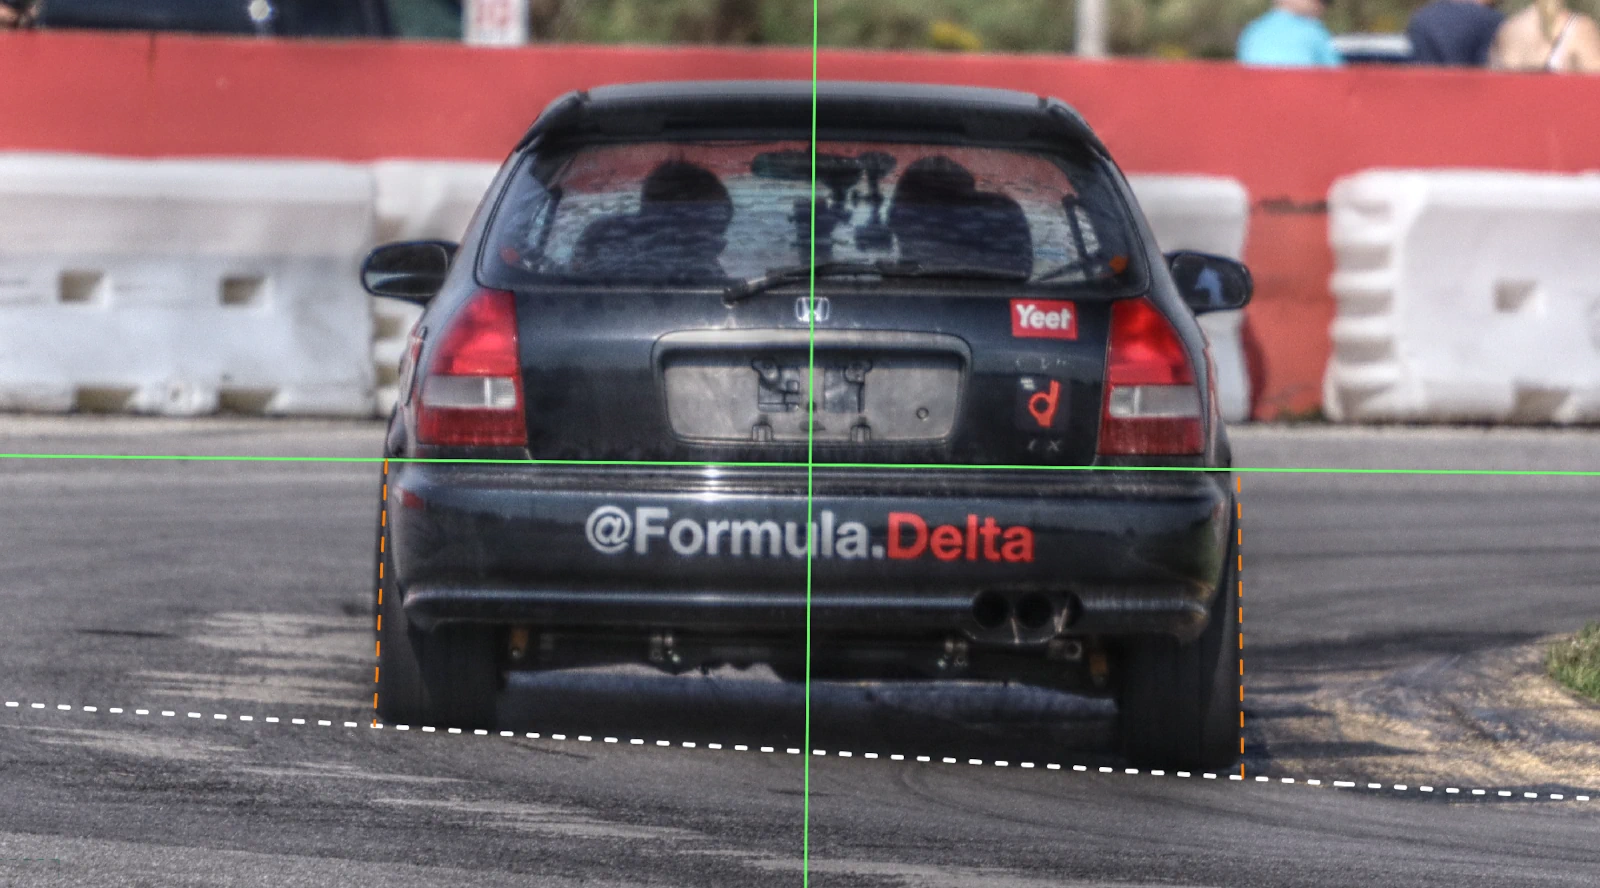
With the image processed and reference lines drawn in our CAD environment, it is now possible to take measurements from the image to gain insight into vehicle state at this moment in time.
Analysis
We will focus our attention on three area of interest: the relative angles with respect to the left wheel, the relative angles with respect to the right wheel, and the relative angle between the ground and the chassis.
Left wheel angles
When zooming into the left side of the vehicle, we can see how the left wheel face has an angle relative to chassis horizontal and to the ground horizontal. These can be used to measure the tire camber angle and tire inclination angle respectively.
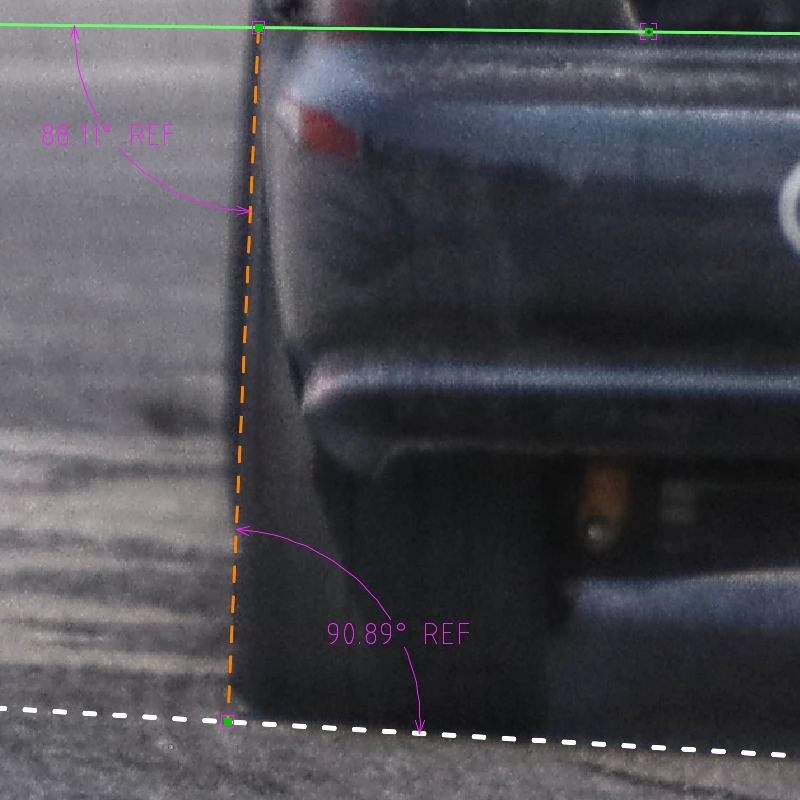
Extracting the values from the analysis and transforming them into their respective coordinate systems gives us the following values. Note that inclination angle is naively stated in SAE J670 tire coordinates irrespective of which side the tire is on.
| Attribute | Value |
|---|---|
| Camber angle [deg] | -1.89 |
| Inclination angle, SAE J670 [deg] | -0.89 |
Although the camber angle is negative relative to the chassis vertical at -1.89 deg, the tire inclination angle is negative with respect to the ground normal at -0.89 deg. We ideally would like to see a slightly positive inclination angle to take advantage of the effect of camber thrust.
Noteworthy of mention is the lateral deflection visible at the tire contact patch. If you look carefully, you can see that near the contact patch the tread pattern and inner sidewall is deflecting towards the inside of the car. This phenomena is what causes the tire to produce an overturning moment.
Right wheel angles
Similar to the left wheel, we can see how the right wheel forms an angle relative to the chassis horizontal and to the ground horizontal, giving us the tire camber angle and tire inclination angle.
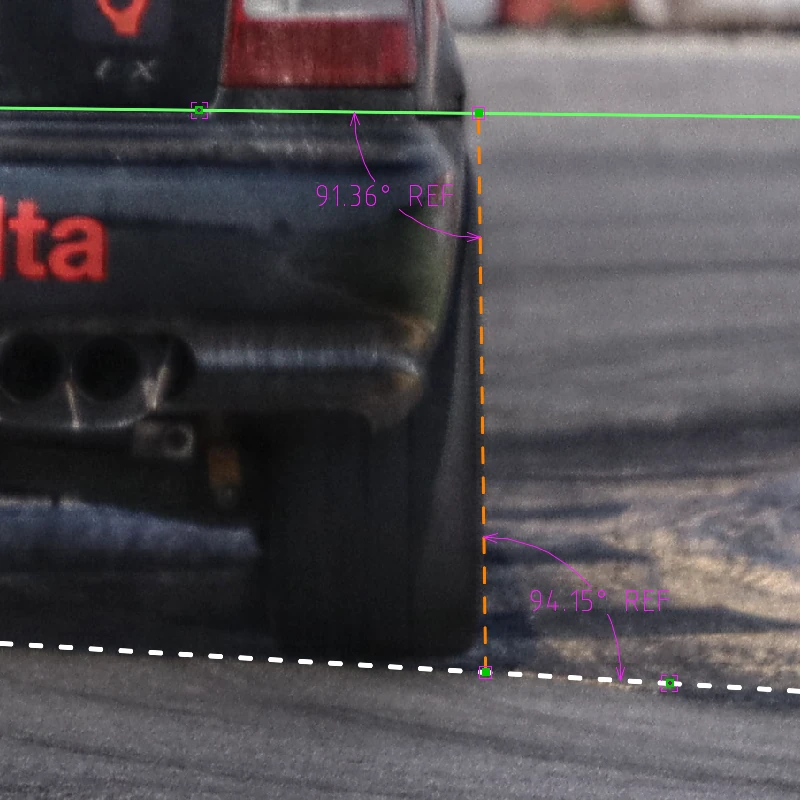
Extracting the values from the analysis and transforming them into their respective coordinate system gives us the following values. Note that the inclination angle is naively stated in SAE J670 tire coordinates irrespective of which side the tire is on.
| Attribute | Value |
|---|---|
| Camber angle [deg] | -1.36 |
| Inclination angle, SAE J670 [deg] | -4.15 |
Chassis roll angle
Zooming out to look at the vehicle as a whole, we see that the chassis vertical forms an angle relative to the ground horizontal. This can be used to measure the chassis roll angle.
To derive another attribute, we can combine the roll angle with lateral acceleration data from another source to approximate the vehicle roll gradient. Unfortunately, the lap timer was off when this image was taken. However, the lap timer was running during other sessions. This can be used to approximate a typical lateral acceleration experienced at this corner.
Transforming the measurement into SAE J670 vehicle coordinates and analyzing the data from our timing system gives us the following values.
| Attribute | Value |
|---|---|
| Chassis roll angle, SAE J670 [deg] | -2.78 |
| Lateral acceleration, p50 [G] | -0.94 |
| Lateral acceleration, p25 [G] | -0.99 |
| Lateral acceleration, p75 [G] | -0.89 |
| Roll gradient, p50 [deg/G] | 2.96 |
| Roll gradient, p25 [deg/G] | 2.81 |
| Roll gradient, p75 [deg/G] | 3.12 |
The roll gradient, assuming the median lateral acceleration for this corner, is approximately 3 deg/G. For comparison, a 2012 Toyota Prius has a measured roll gradient of 4.4 deg/G, and a 2017 Jaguar F-Pace has a roll gradient of approximately 3.5 deg/G.
Final comments
From a single photograph, we measured the dynamic camber and inclination angles of the rear wheels and the chassis roll angle of the EK20R going around T12 at Toronto Motorsports Park. By combining these measurements with data from the lap timing system, were were able to approximate the roll gradient of the vehicle. We found that the inclination angle of the rear left tire to be of opposite sign to the tire lateral force, suggesting that there is insufficient static camber or camber gain to take advantage of the effects of camber thrust. The roll gradient estimate is comparable to a high performance sports car.
Being able to clearly see vehicle dynamics in action is always a delight. We were able to get a glimpse into the vehicle state, using a photo to derive data that conventionally gets measured with expensive equipment reserved for the top OEMs. It is a misunderstanding to believe that static alignment is the final measurement to consider in vehicle development. Ultimately, it is the dynamic alignment when the vehicle is subjected to the forces of a maneuver that needs to be considered for vehicle setup.
This photo raised good questions about vehicle performance for the EK20R. We see an opportunity to experiment with the rear alignment to ensure that the tire is upright with respect to the ground during cornering. While the ride height is unconventionally high for a prepared Honda Civic, we are generally happy to keep the car softly sprung and focus on improving the overall mechanical grip of the vehicle.
The source image is used with permission from its author.
Acknowledgements
Thanks to Troy Cheron for sharing the photos from the lapping day at Toronto Motorsports Park. Without Troy’s time and dedication to take these photos, this analysis would not have been possible.
Reference
- Milliken, William F., and Douglas L. Milliken. Race car vehicle dynamics. Vol. 400. Warrendale: Society of Automotive Engineers, 1995.
- Van Hoek, R. Vehicle state estimation using the state dependent Riccati equation technique. Diss. MA thesis. Eindhoven University of Technology, 2016.
- MacKenzie, Angus. “How The Porsche Macan Helped Jaguar F-Pace Development.” MotorTrend, 23 Apr. 2016, www.motortrend.com/news/porsche-macan-helped-jaguar-f-pace-development.