Cornering Compliances of a Typical Road Vehicle
In our 2018 Ontario Time Attack debrief series, we made substantial use of the cornering compliance concept to understand vehicle handling. After identifying the parameters of the vehicle, we took advantage of the information by studying the vehicle sensitivities.
However, the analysis left something to be desired. As the vehicle-under-test is modified from its factory configuration, we did not have a comparison point for the vehicle as designed by the manufacturer. Simply, we did not have an intuition of how it compares to a typical road vehicle.
To better understand the on-centre handling of a typical unmodified road vehicle, we take our daily driver and perform the understeer gradient and pulse steer tests.
The Vehicle
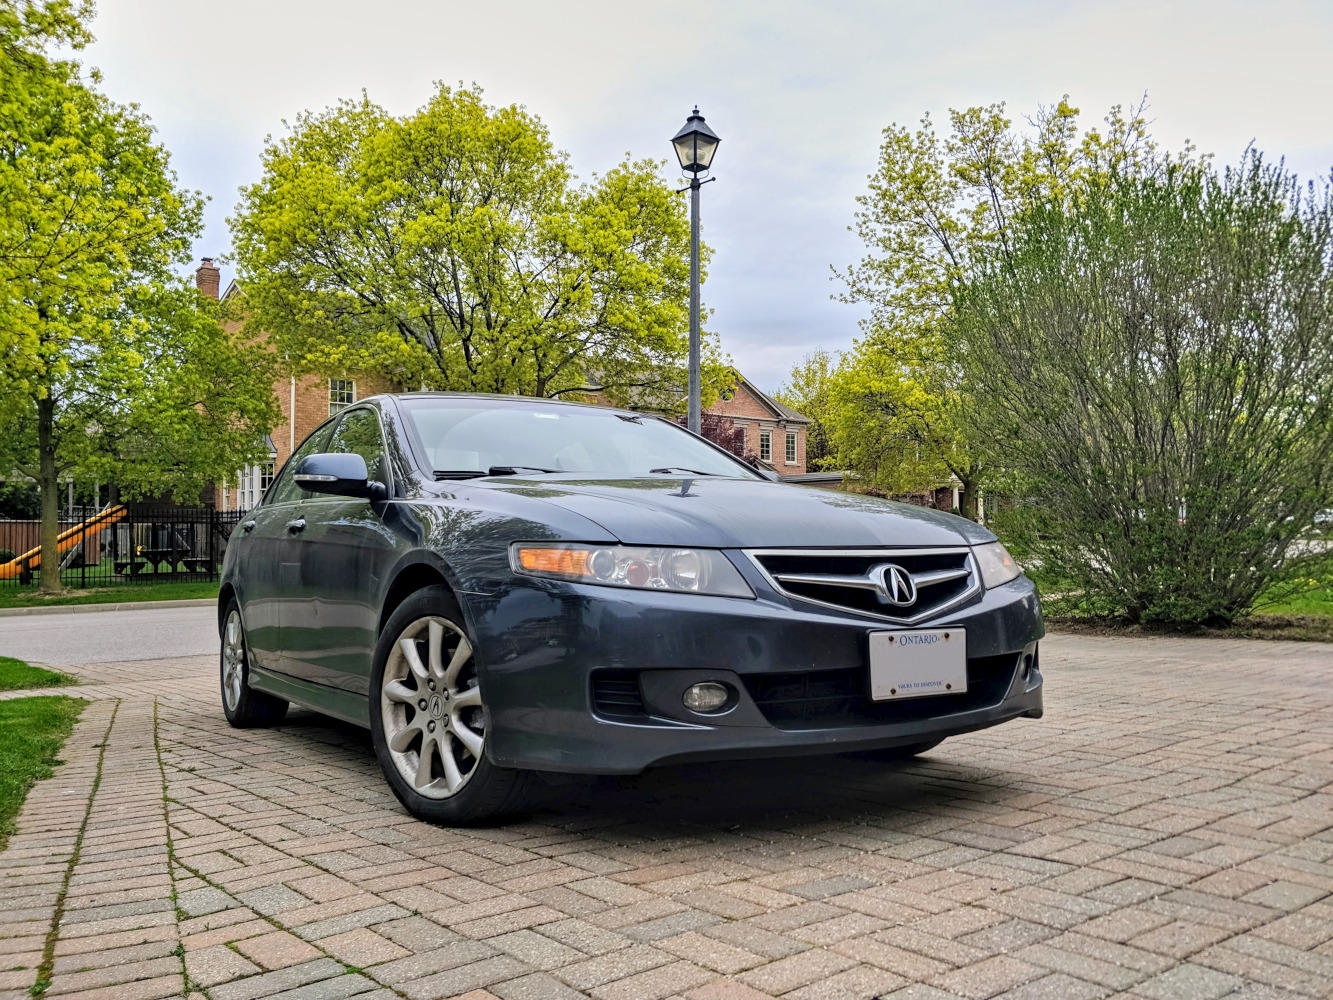
The vehicle-under-test is a 2007 Acura TSX - a four door family sedan known for its more sporting handling compared to its Honda cousin. As a daily driver, the only modification is the wear-and-tear from repeated excursions into the salted roads of winter.
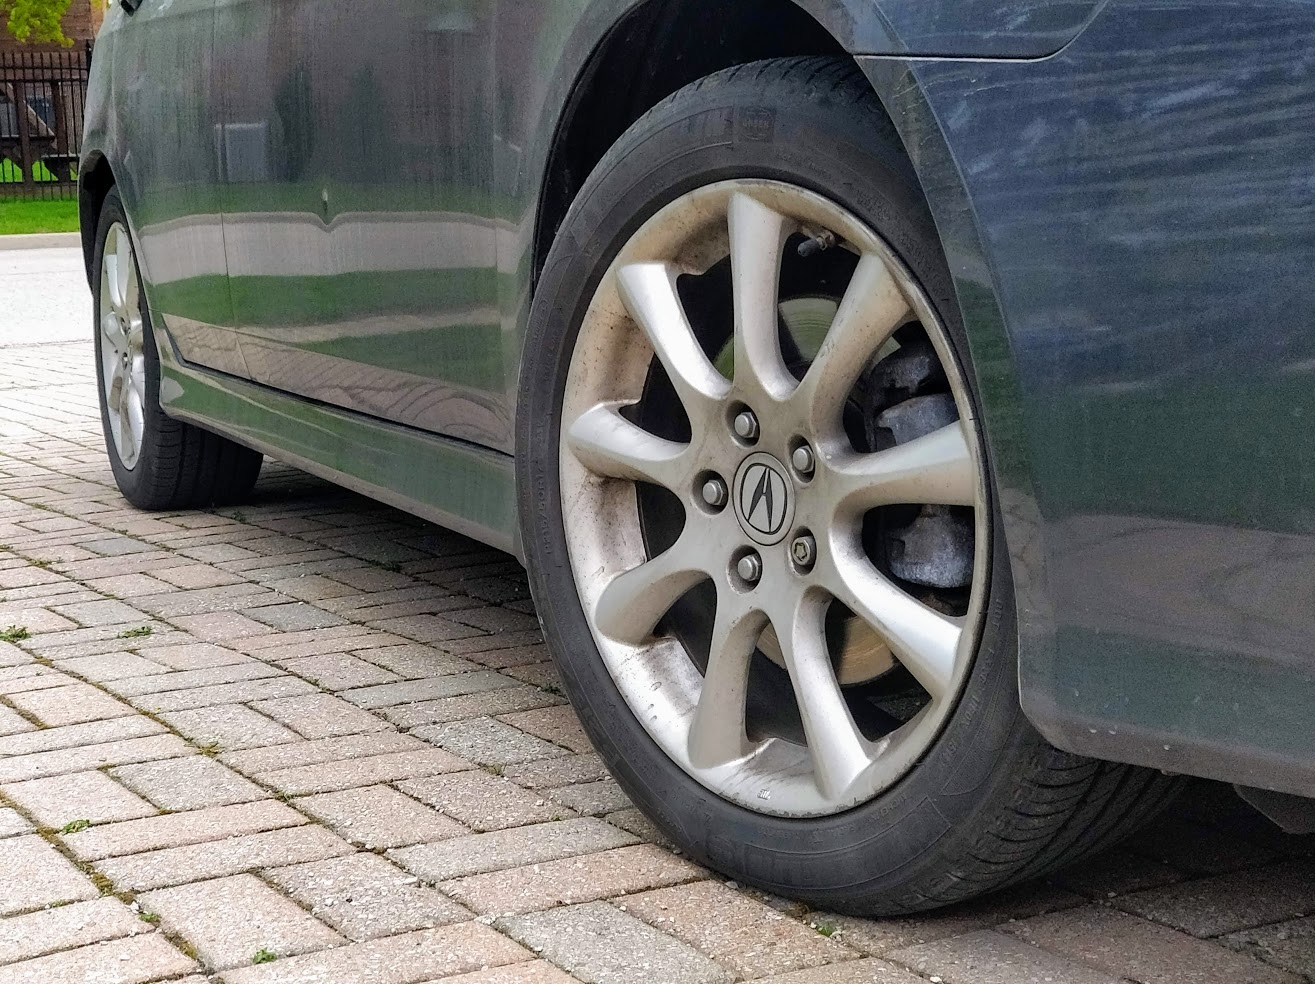
The car rides on 215/50R17 Michelin Primacy MXM4 on all four corners. This is the same tire size and construction as factory trim.
We instrumented the vehicle with the Autosport Labs Racecapture/Pro Mk.II for data acquisition. The built-in inertial measurement unit and GPS system were used to collect the lateral acceleration and speed signals.
The vehicle provides a steering encoder signal via CAN bus. This signal is decoded via the data acquisition system. Because this signal is zeroed on ECM startup, a static lock-to-lock procedure is performed to find the scaling and offset.
The Results
The following information is used for system identification:
| Symbol | Value | Unit | Description |
|---|---|---|---|
| \(a\) | 1.041 | m | Distance from CG to front axle |
| \(b\) | 1.629 | m | Distance from CG to rear axle |
| \(m\) | 1619 | kg | Vehicle mass |
| \(I\) | 2746 | kg m2 | Vehicle yaw inertia |
| \(N\) | 14.8 | - | Steering ratio |
The identification process resulted in the following values:
| Symbol | Value | Unit | Description |
|---|---|---|---|
| \(D_f\) | 6.7 | deg/g | Front cornering compliance |
| \(D_r\) | 3.1 | deg/g | Rear cornering compliance |
| \(K\) | 3.6 | deg/g | Understeer gradient |
Analysis
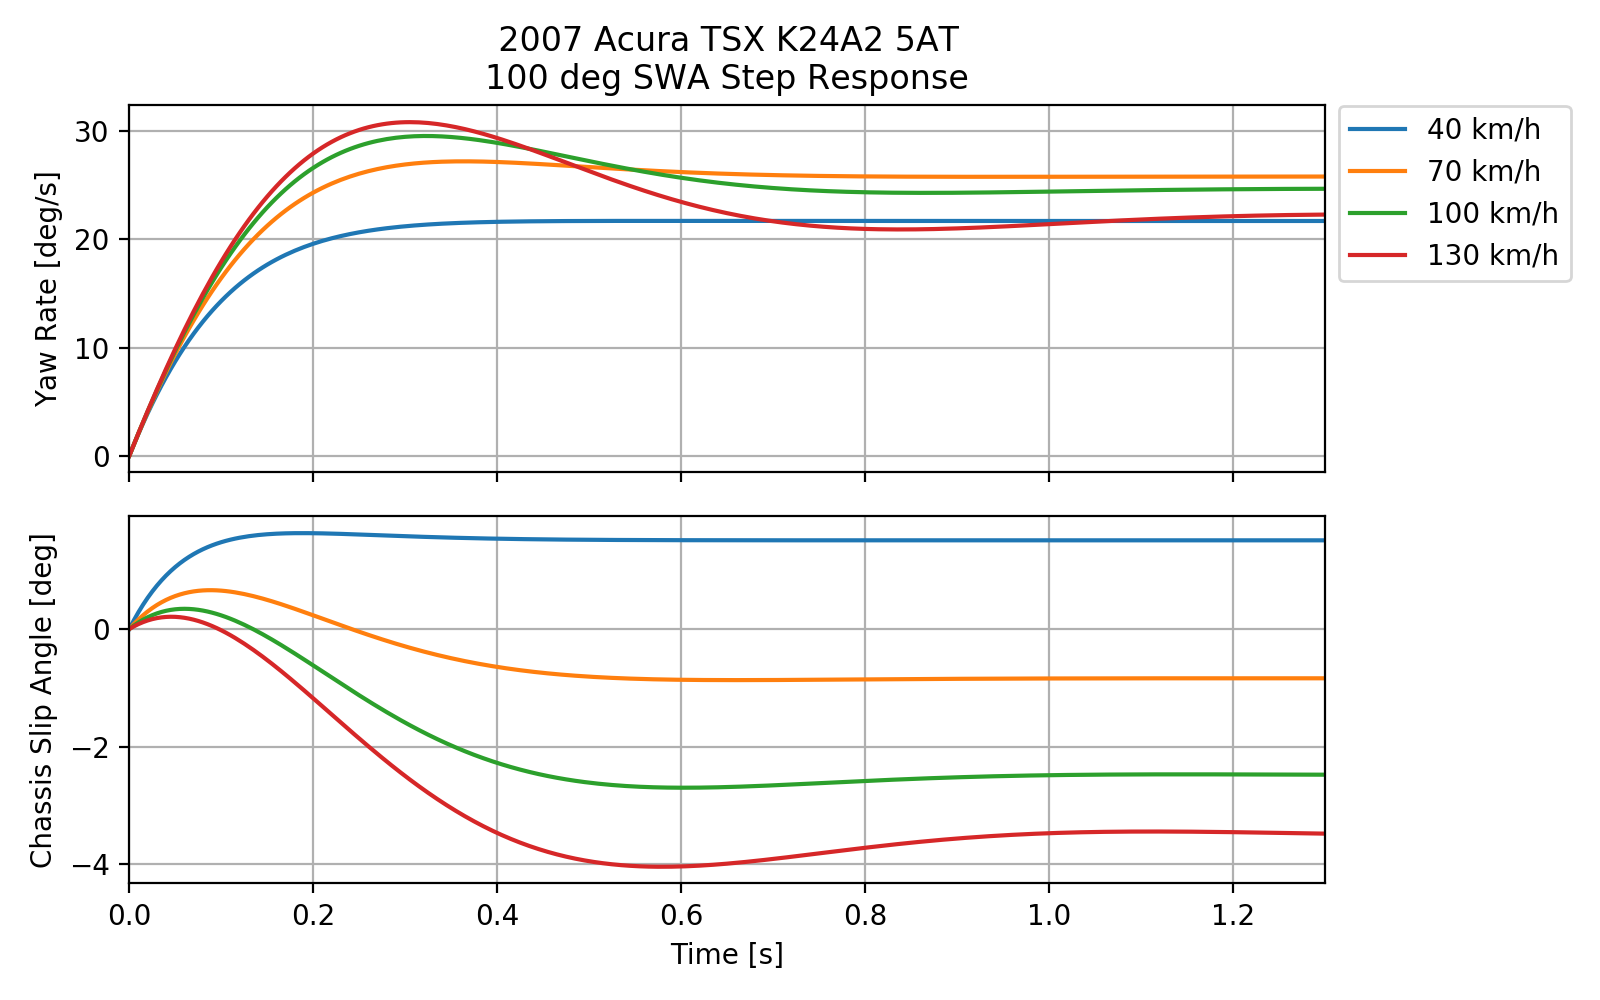
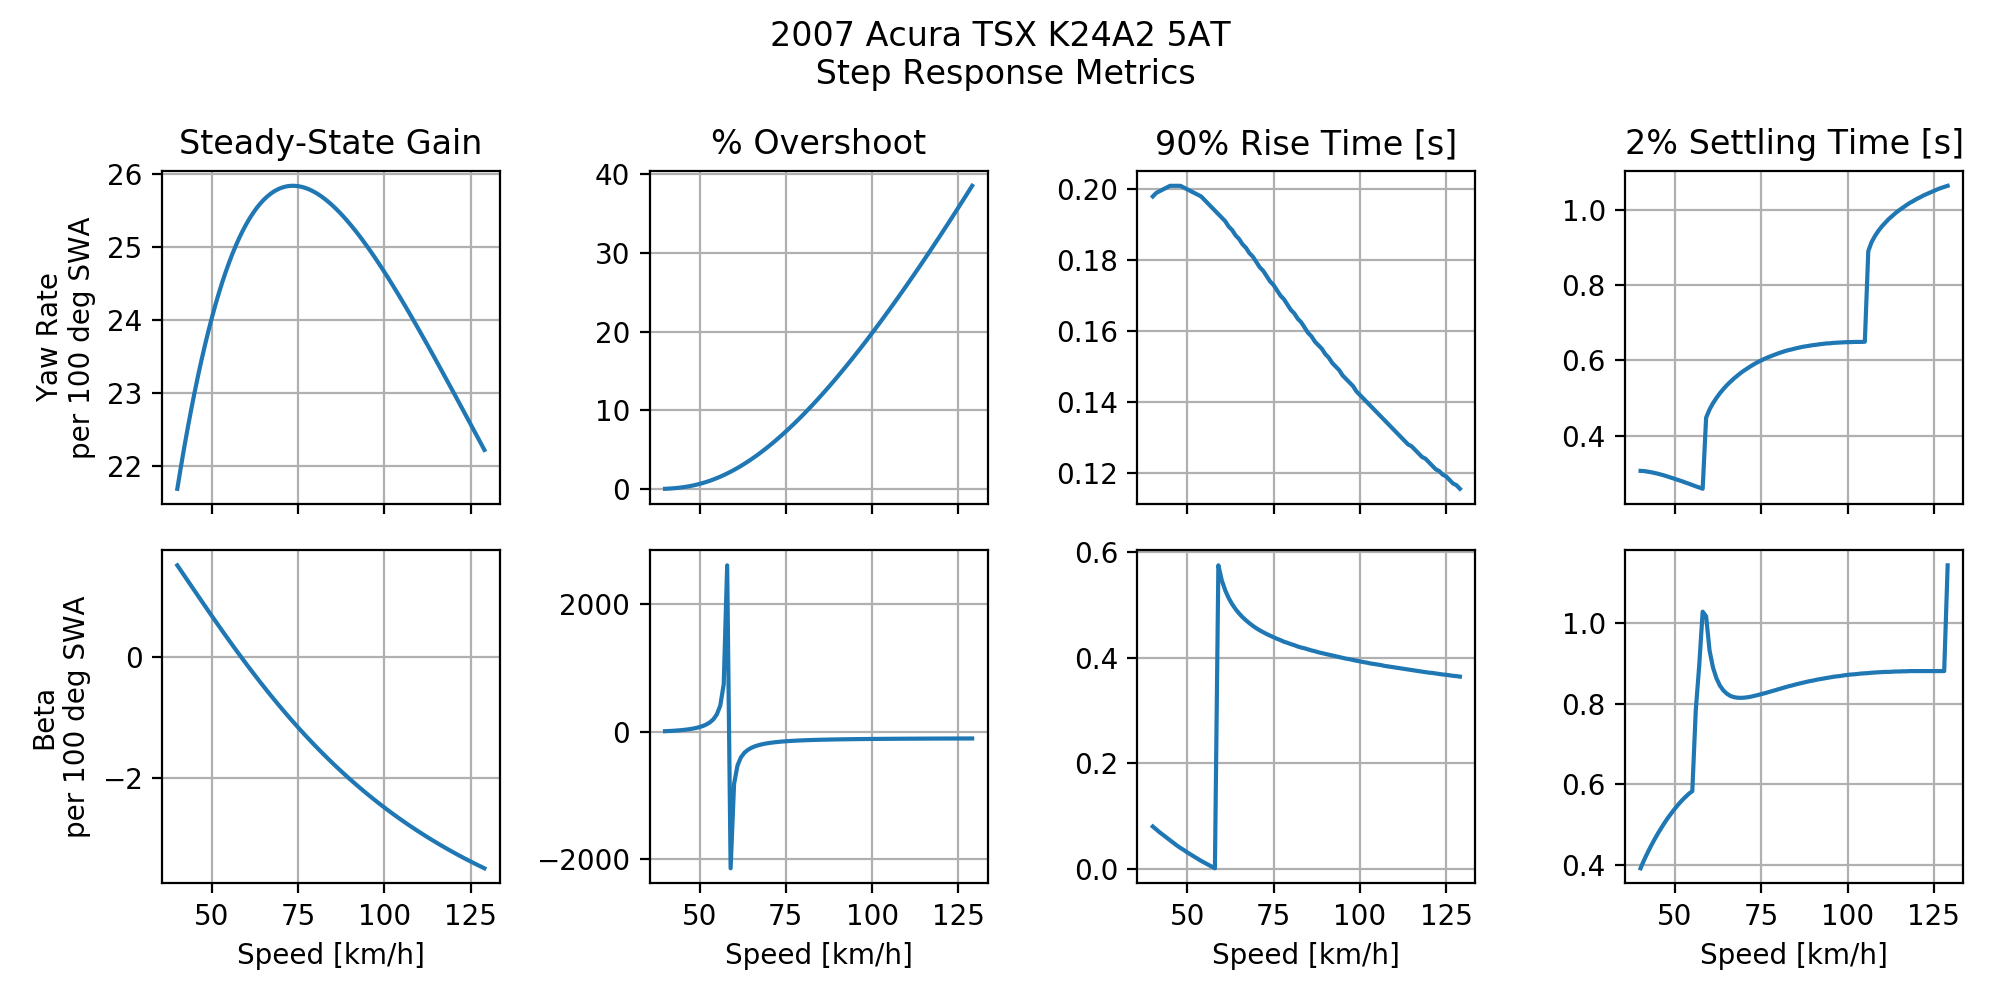
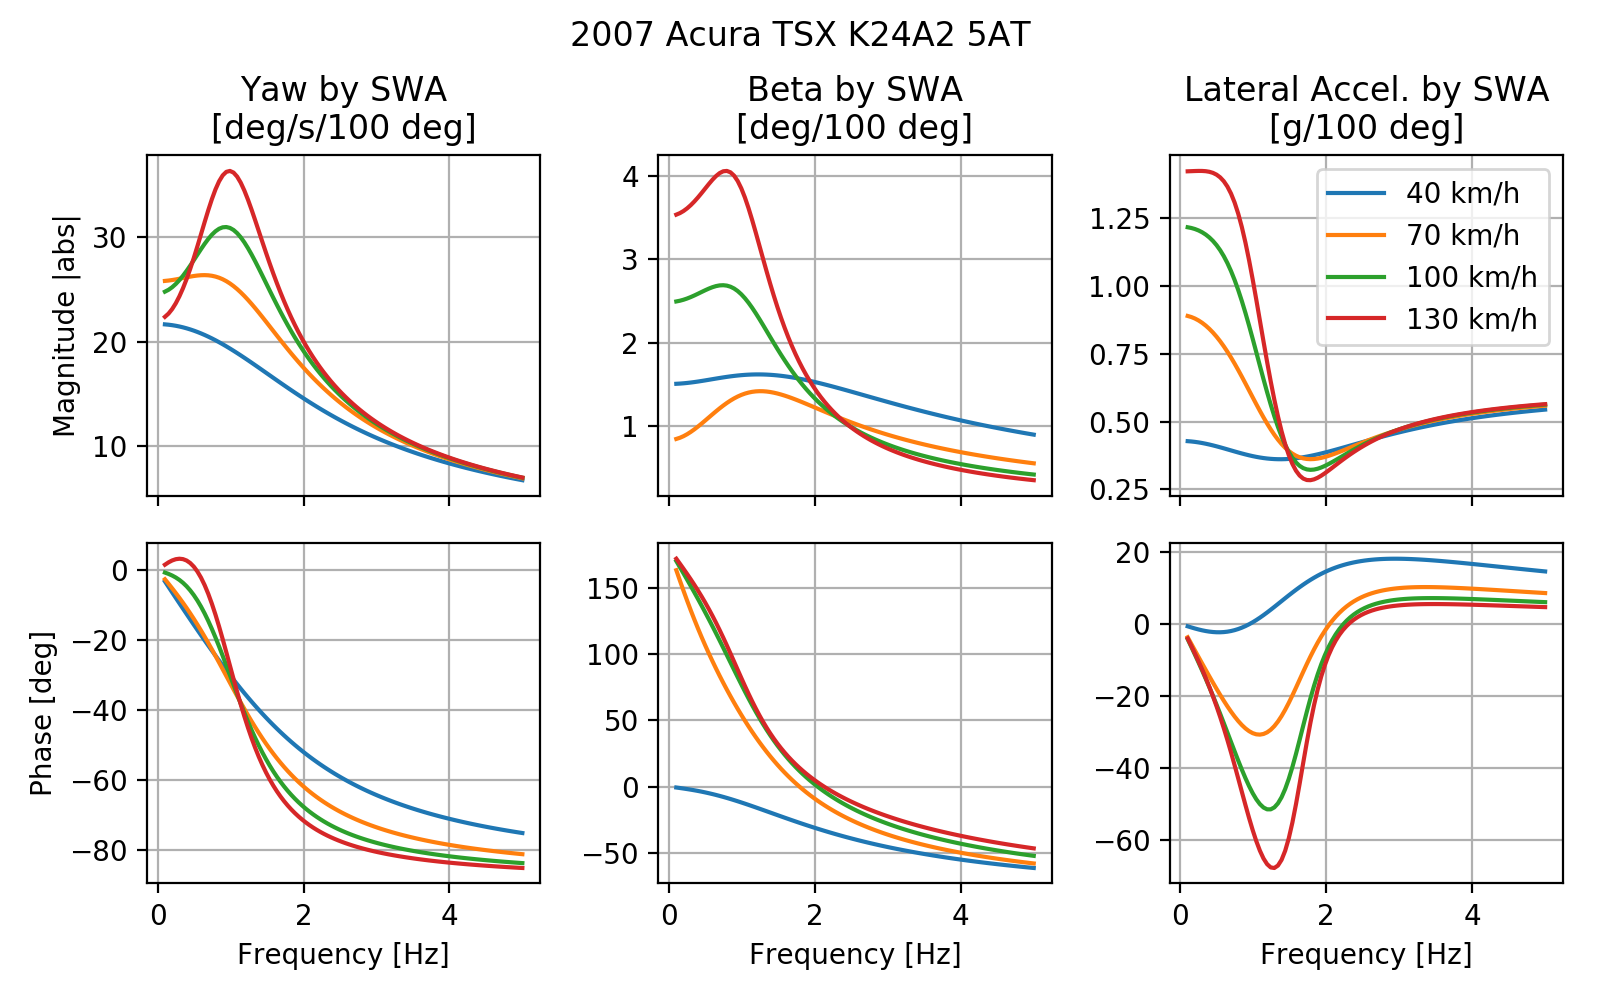
The following plots show the step response, step response metrics and frequency response of the simulation model. You can compare these response to our previous article on on-centre vehicle handling.