OTA 2018 Debrief: On-Centre Vehicle Handling
2019/08/22 update: this article is part of a series on on-centre vehicle handling using linear system analysis. For further reading, please feel free to check out my other posts:
Welcome to the Ontario Time Attack debrief files, a series of articles where we answer vehicle dynamics questions we always wanted to ask, but could not tackle during the racing season. In this instalment, we quantify vehicle handling by computing handling metrics using the linear single-track vehicle model.
Foreword
We have dedicated a lot of time into identifying the understeer gradient and cornering compliances in our previous articles, but we did not explain our motivation. Here is a bit of an explaination:
Ontario Time Attack is an IPAX equalized series. Modifications made to the vehicle are equalized to offset the expected performance enhancement. Therefore, the challenge of OTA is twofold: to maximize the vehicle performance per unit performance index (PI), and to pilot the vehicle as quickly as possible during the timed sessions.
In a competitive environment, simultaneously developing the car and driver is extremely difficult. Our strategy is to use vehicle dynamic simulation to develop the vehicle. This is advantageous because vehicle development can continue without the need of track time.
We take the view that success in the series requires total system performance - car and driver must work harmoniously to achieve maximum performance. However, for practical reasons we opt to focus on driver development at the race track, and use vehicle dynamic simulation back home in the pits.
Handling Metrics
Driving is inherently a subjective experience relying on human input and feedback to control the vehicle. Handling metrics provide an objective measure of this experience.
Objective measurements are correlated to subjective evaluation. Corolla et al. show that frequency response metrics are highly correlated to subjective vehicle evaluations. For example, the yaw rate frequency response is related to notions of controllability and impulse control.
By this relationship, we strive to understand objective measures of vehicle handling in the understanding that there is strong correlation to on-track subjective evaluation.
We present a variety of on-centre handling metrics from a computer simulation of a linear single-track vehicle model.
Experimental Setup
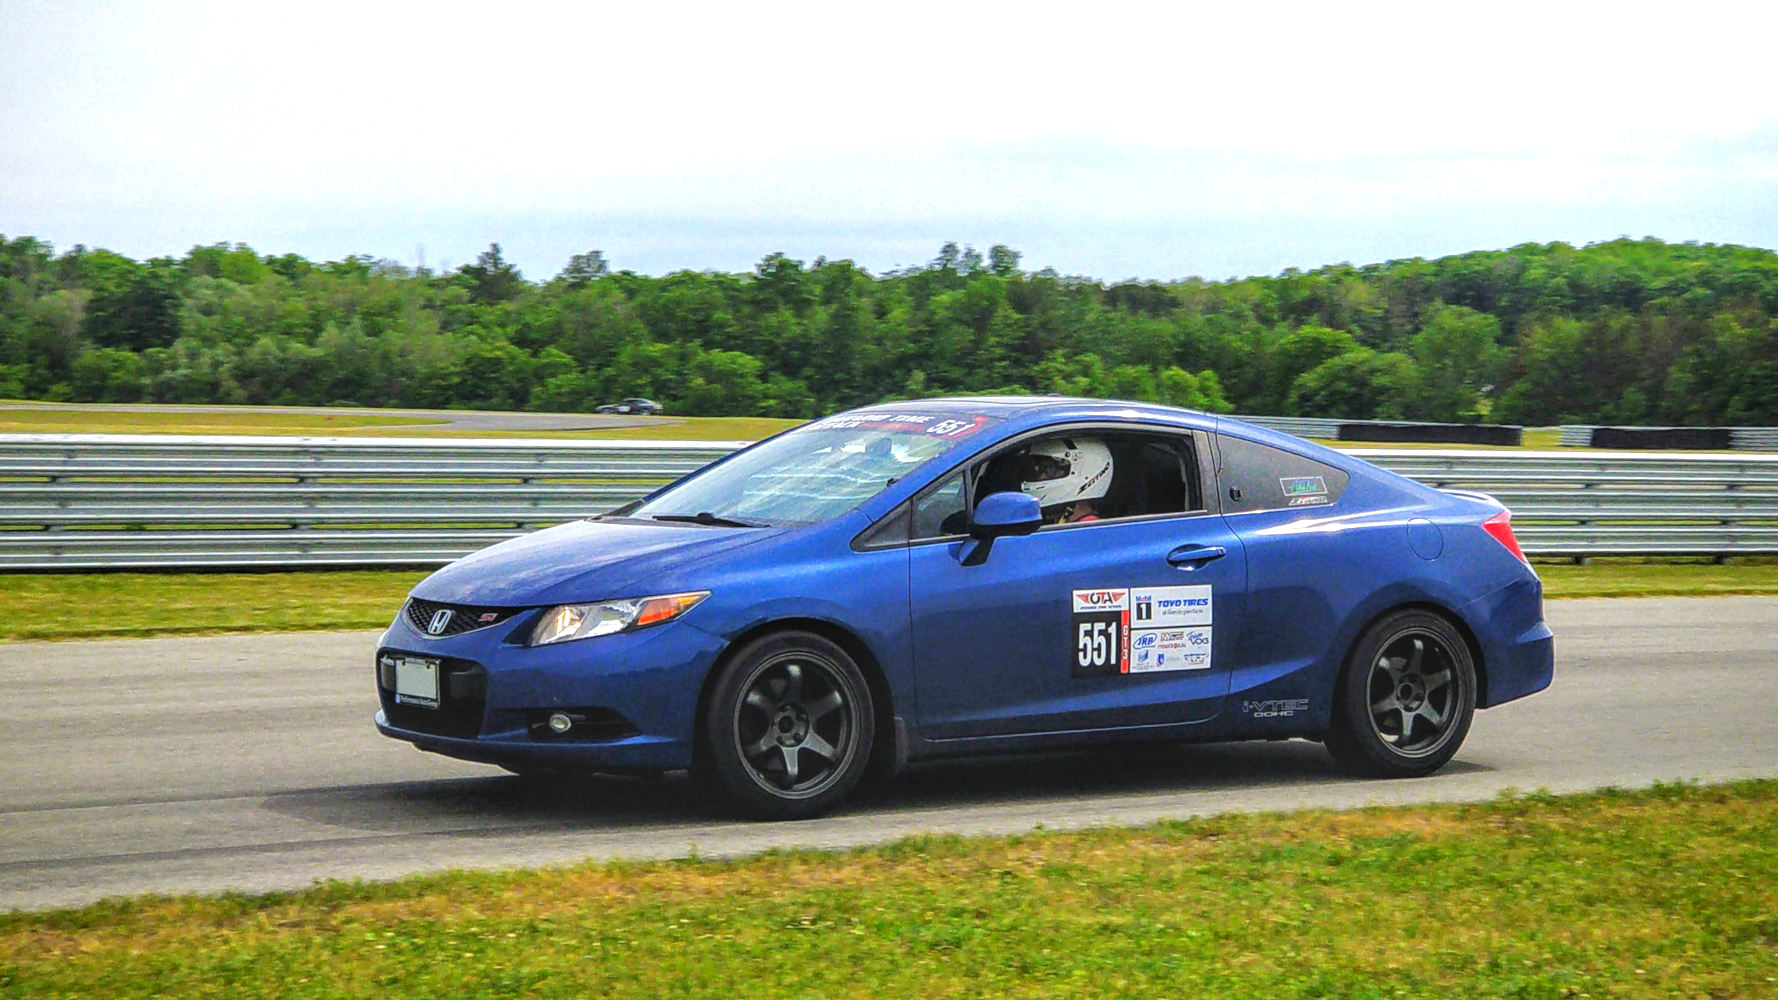
We will be evaluating the #551 2012 Honda Civic Si for its on-centre handling characteristics. All evaluation is performed in computer simulation using the vehicle model developed in our previous articles.
The following parameters are used to represent the vehicle:
| Symbol | Value | Unit | Description |
|---|---|---|---|
| \(a\) | 0.996 | m | Distance from CG to front axle |
| \(b\) | 1.624 | m | Distance from CG to rear axle |
| \(m\) | 1450 | kg | Vehicle mass |
| \(I\) | 2345 | kg m2 | Vehicle yaw inertia |
| \(D_f\) | 9.6 | deg/g | Cornering compliance, front |
| \(D_r\) | 4.1 | deg/g | Cornering compliance, rear |
| \(N\) | 16.08 | - | Steering ratio |
Step Response
We begin by evaluating the system response to a step input in the time domain. This is the time response of the system when the input is instantaneously changed from zero to a non-zero value. This is a good response to study as it has on-track implications - it can be thought of as an analogue to corner entry.
It is important to note that the unit step function is an idealized input; a step function is impossible to achieve in reality. However, its ubiquity in literature provides a foundation for study.
We start by looking at the yaw rate and chassis slip angle response to a 100
deg SWA step. Four speeds are shown to demonstrate the speed effect on the
response.
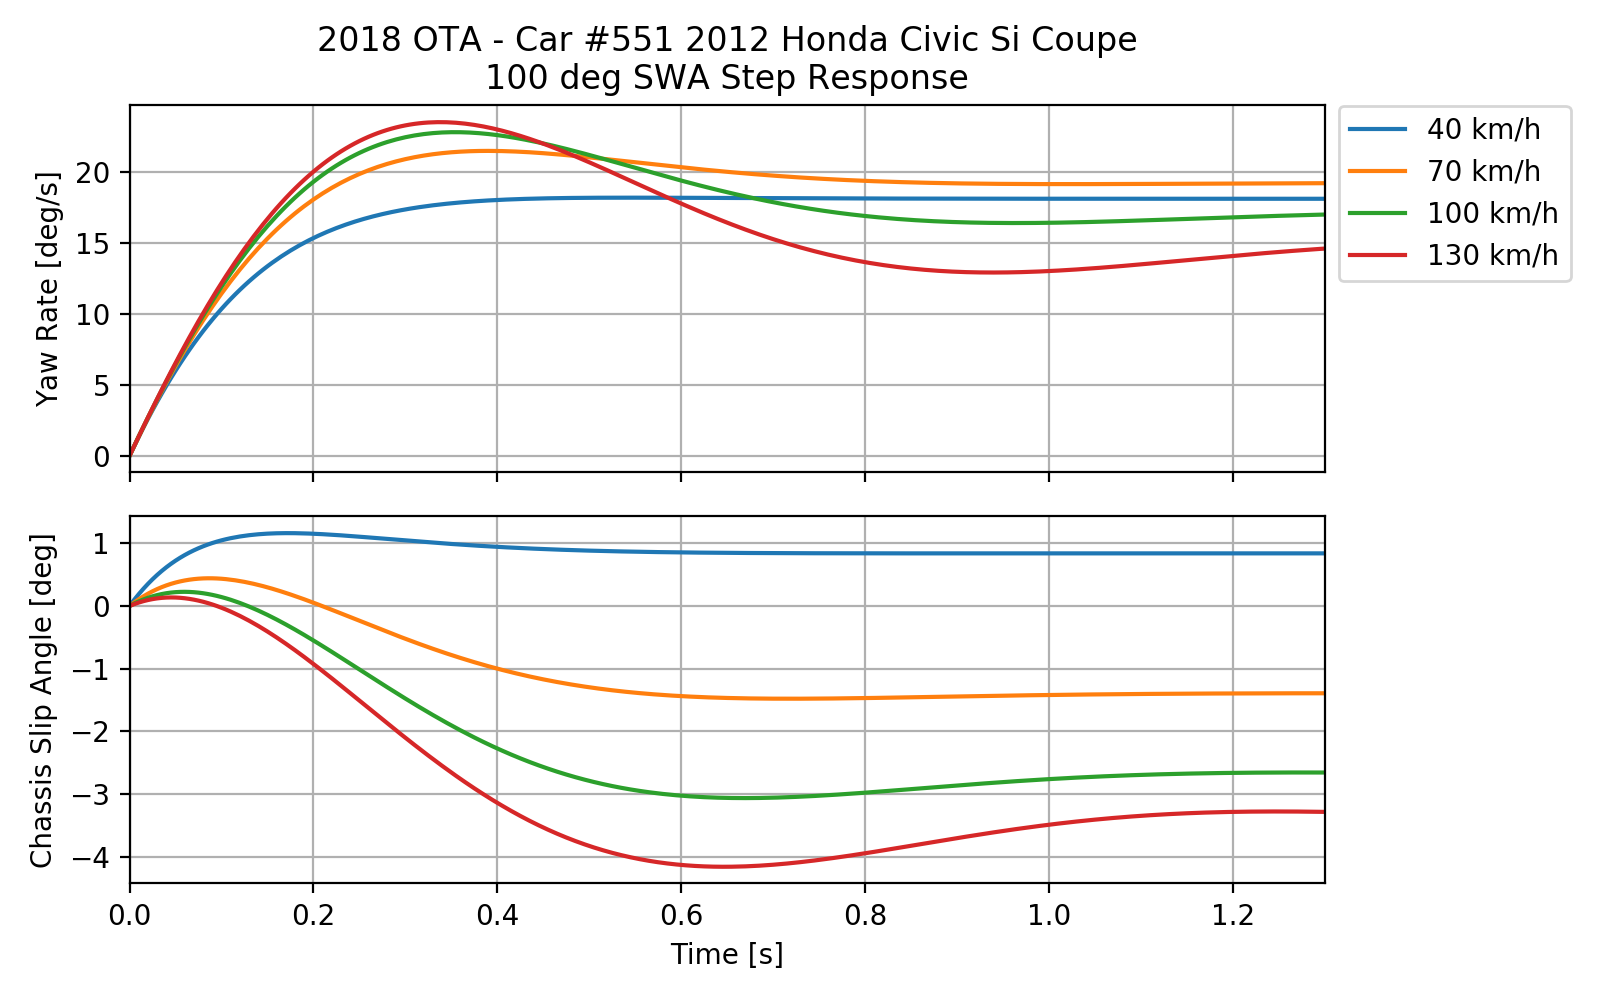
We can already see some interesting handling behaviour. As the velocity increases, the yaw rate becomes more oscillatory and takes longer to settle. The chassis slip angle is even more peculiar; at low speed the steady-state response is positive, but at higher speeds the response is negative. Additionally for these higher speeds, the chassis slip angle initially goes in the opposite direction to its steady-state value!
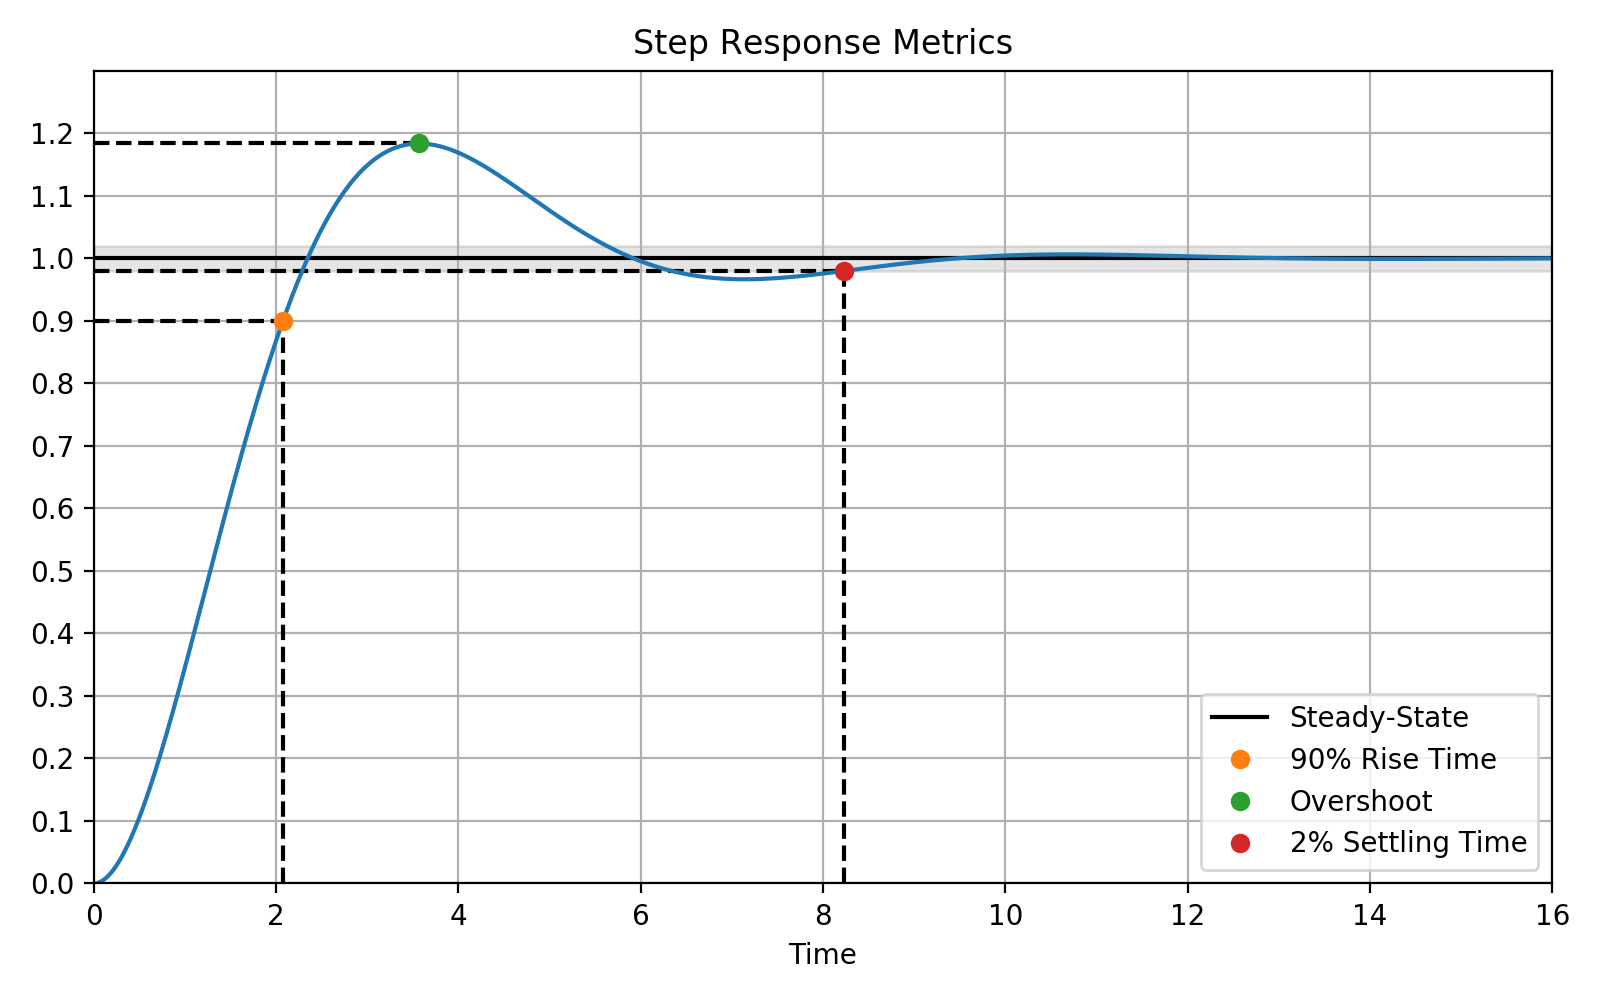
We can quantify some of these characteristics by parameterizing the response. Borrowing terminology from control theory lets us describe our observations more precisely.
- Rise Time - time to achieve 90% of steady-state
- Overshoot - maximum percentage over the steady-state value
- Settling Time - time taken for the signal to stay within a ±2% band of steady-state
- Steady-State Gain - the magnitude of the output over input when the signal is no longer changing
These metrics are visualized in the figure below:
By extracting these metrics over the working velocity of the vehicle, we can show the evolution of the step response in terms of these metrics.
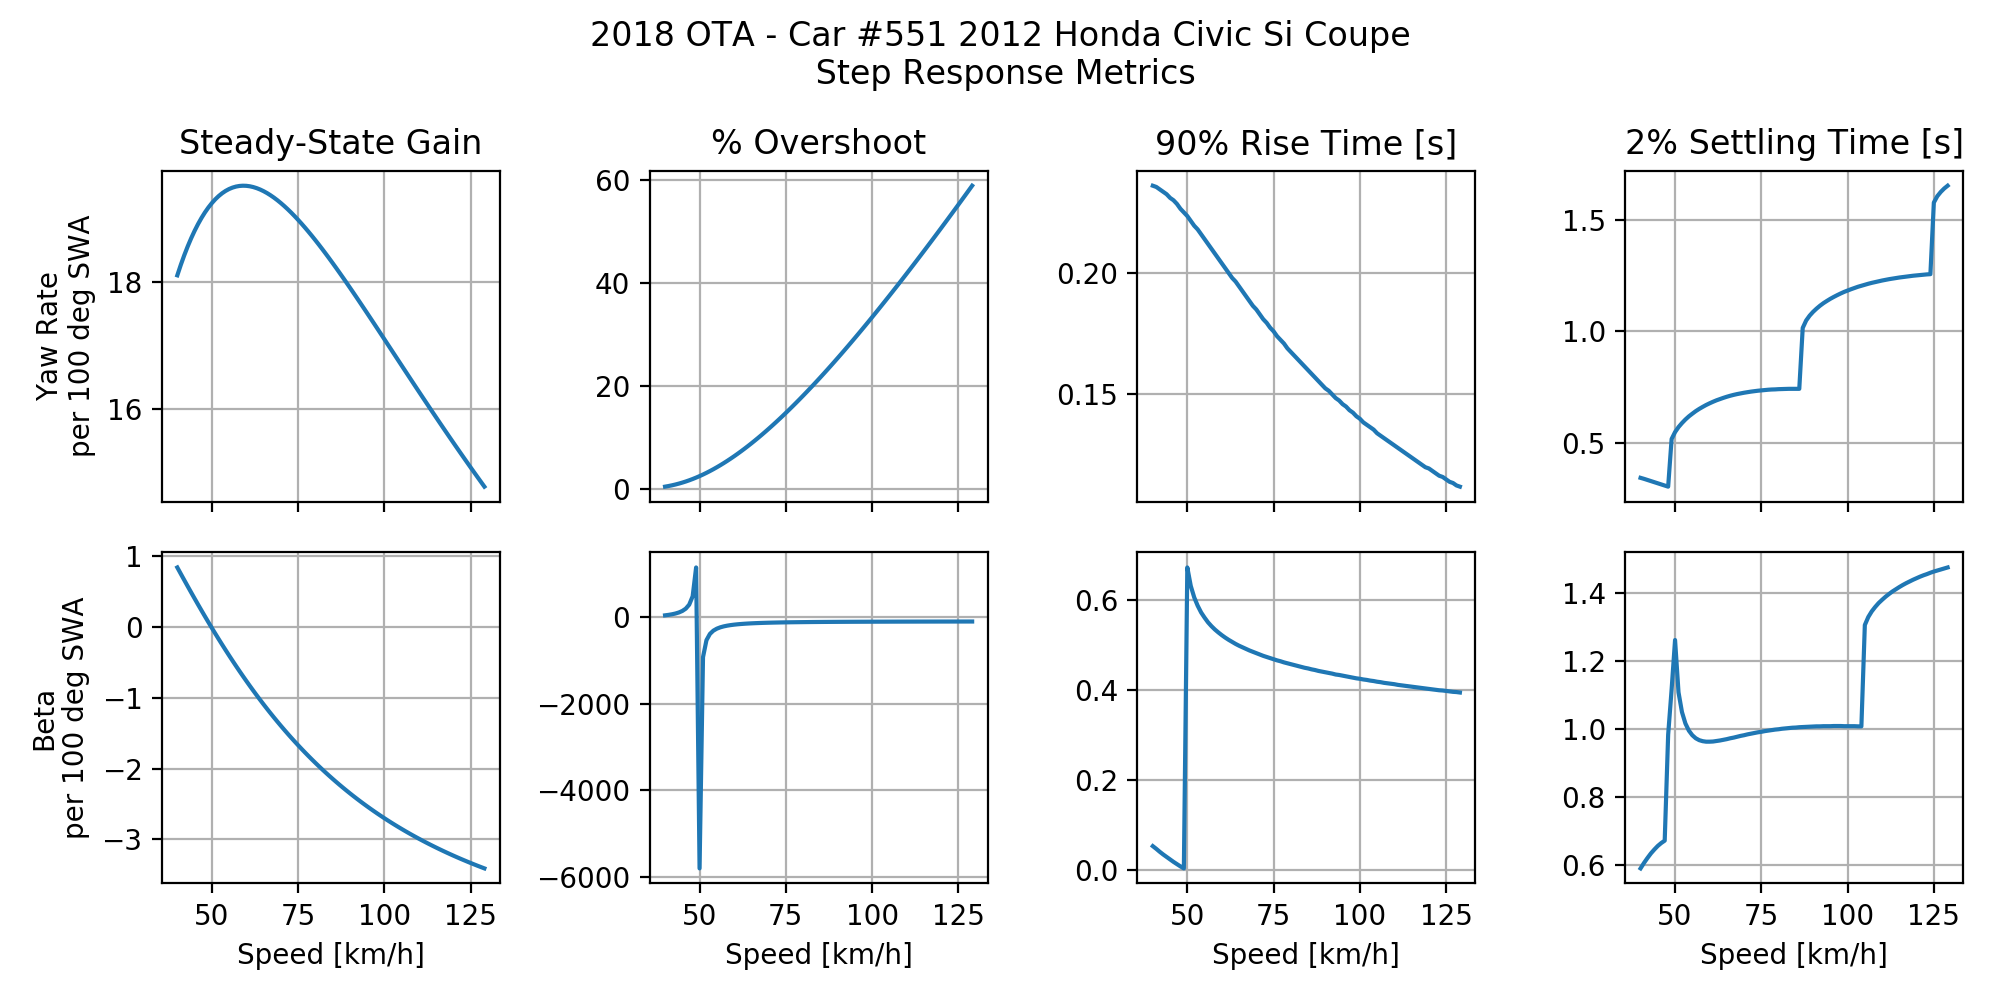
There are a few key observations that can be made:
- The yaw rate gain is fairly insensitive to speed. In other words, the steady-state yaw rate gain will remain similar across the working speed of the vehicle.
- The yaw rate response becomes less controlled as speed increases. Observe the increase in the overshoot and the settling time as speed increases.
- The steady-state chassis slip angle gain crosses zero at around 50 km/h. This is the tangent speed. The chassis slip angle response differs above and below this speed. The metrics misbehave near the tangent speed partly because of the mathematical singularity at this point.
- The yaw rate and chassis slip angle rise and settle out at varying points in time depending on speed. Below the tangent speed, the chassis slip angle is first to rise. However, above the tangent speed, the yaw rate is the first to rise.
Frequency Response
Frequency domain analysis provides an alternative - if a bit abstract - view into the vehicle response. Studying the vehicle response in the frequency domain allows application of literature in control theory to analyze the car.
The Bode plot describes the magnitude and phase response of the system with respect to frequency of the input. The frequency response of the yaw rate, chassis slip angle and lateral acceleration with respect to the steering wheel angle are shown on a linear scale.
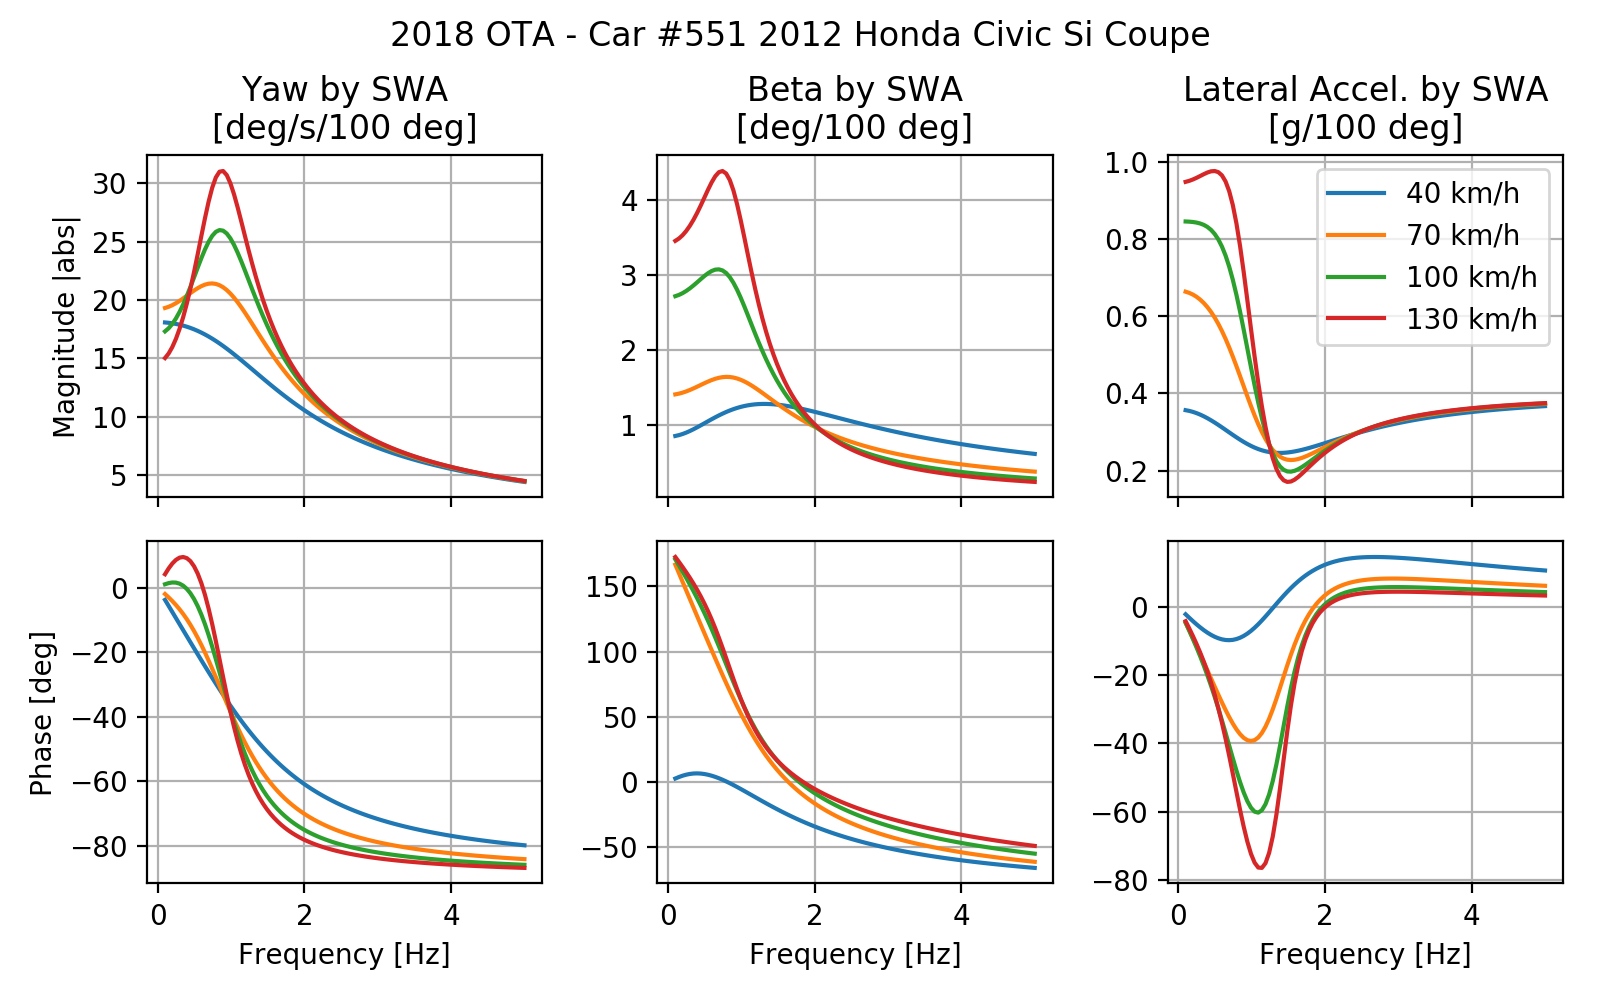
Findings from the step response results are confirmed in the frequency domain. As speed increases, we see the resonant peak increase in the yaw rate response. This is consistent with the step response metrics; the yaw rate overshoot and settling time increases as speed increases. The chassis slip angle is less resonant, however the steady-state response is 180 degrees out of phase above 70 km/h.
Another way to visualize the frequency response is to understand the placement of system poles and zeros. We show the variation in pole/zero placement with velocity in a root locus plot.
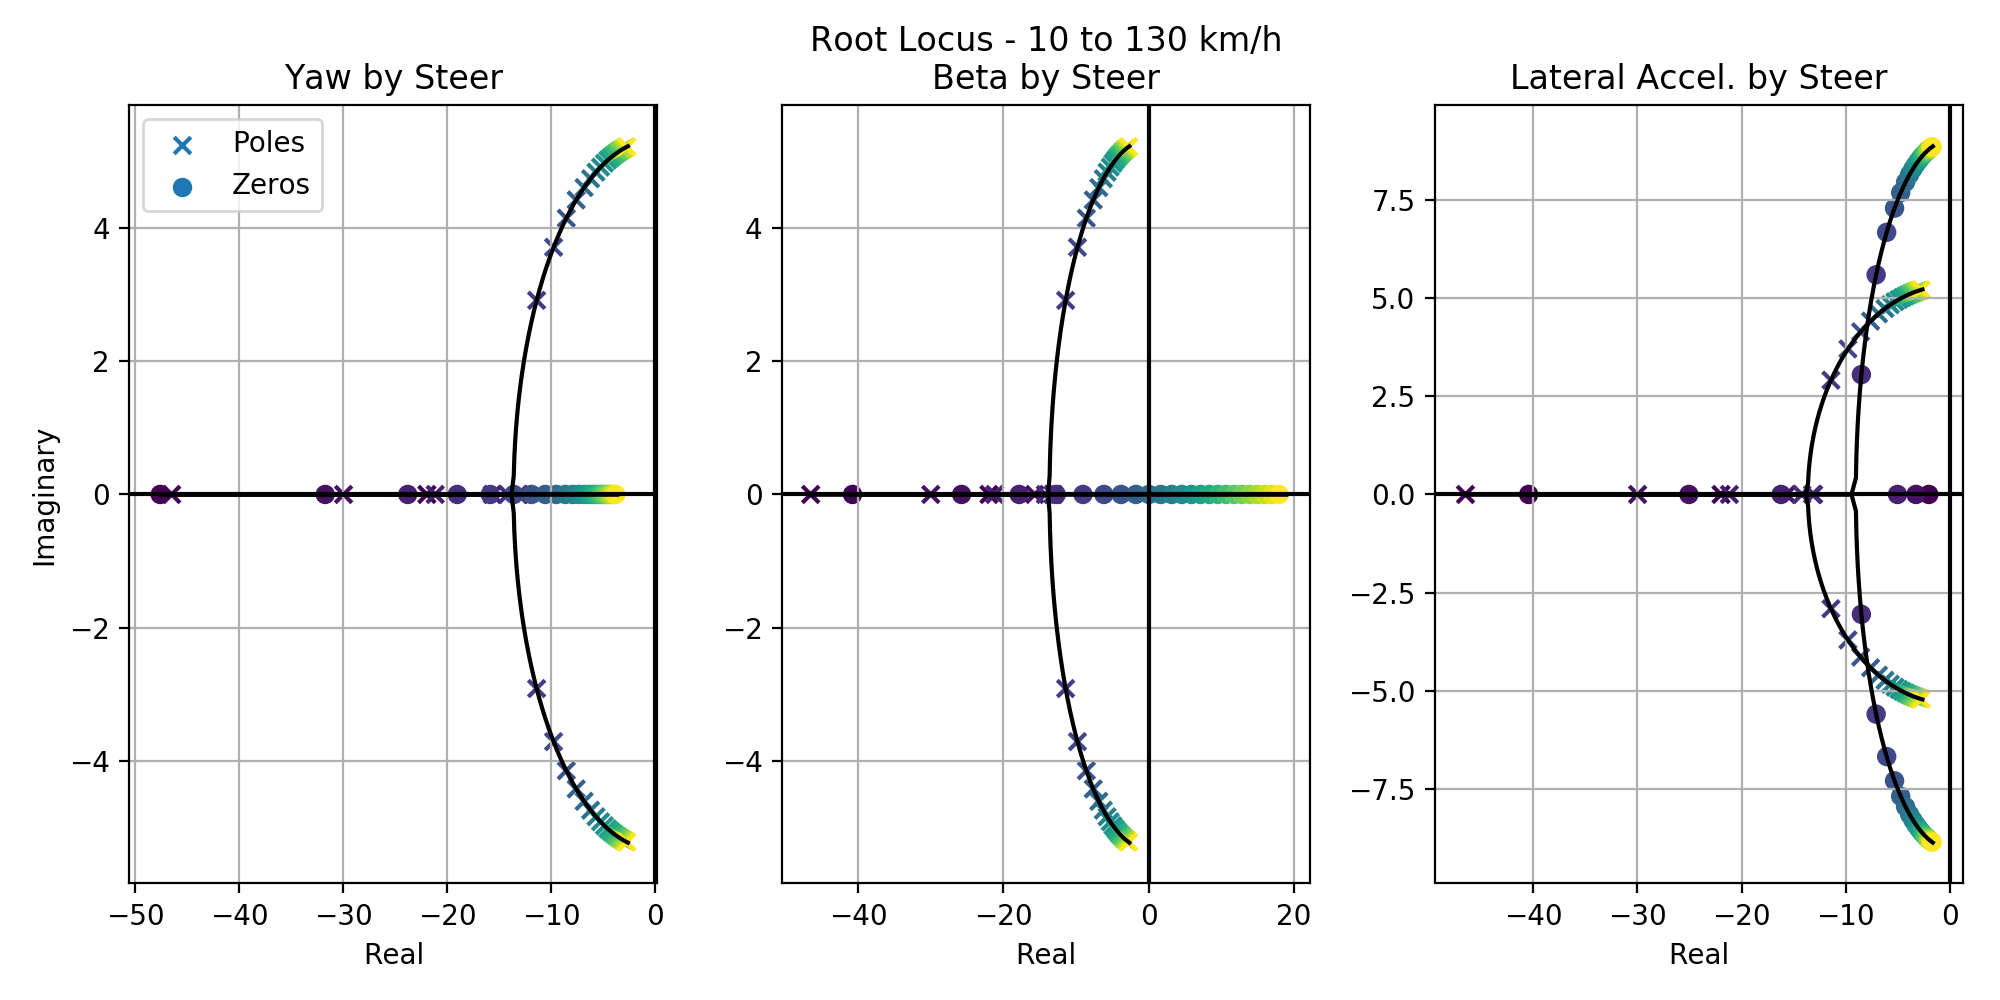
Yaw rate, chassis slip angle and lateral acceleration all share the underlying system dynamics as they share the same pole locations. The variation in response is attributable to different placement of system zeros.
For the chassis slip angle, the zero crosses over into the right-hand plane as the velocity increases. The introduction of a non-minimum phase zero explains the undershoot experienced above the tangent speed.
Lateral acceleration has two real zeros at low speeds. As speed increases, the zeros become complex conjugate pairs. These zeros become highly oscillatory at high speeds.
Summary
The purpose of developing handling metrics is to describe specific aspects of vehicle handling in a quantifiable way. These metrics are highly correlated to subjective evaluation, therefore understanding these objective measures can help explain subjective driver feedback.
Vehicle dynamic simulation delivers insights more rapidly than on-track testing, and without the need of laboratory-grade instrumentation. In this example, we were able to study the vehicle with computer simulation in a way that is not realistically possible due to facility and time constraints.
With on-centre handling metrics, we established the baseline transient handling performance. To take the analysis to the next level, we can take advantage of our vehicle simulation to evaluate the influence of vehicle parameters on the open-loop response. As we begin preparations for the new season, understanding the sensitivity to vehicle changes will help us determine which modifications will have the biggest impact.
A big thank you to OTA competitor Joseph Yang in the #551 2012 Honda Civic Si for collaborating with us on this article. It would not be possible without the support of Joseph Yang and his sponsors.
References
- Milliken, William F., and Douglas L. Milliken. Race car vehicle dynamics. Vol. 400. Warrendale: Society of Automotive Engineers, 1995.
- Bundorf, R. Thomas, and Ronald L. Leffert. The cornering compliance concept for description of vehicle directional control properties. No. 760713. SAE Technical Paper, 1976.
- Chen, David. Subjective and objective vehicle handling behaviour. Diss. University of Leeds, 1997.
- Crolla, D. A., et al. Vehicle handling assessment using a combined subjective-objective approach. No. 980226. SAE Technical Paper, 1998.
- Gil Gómez, Gaspar. Towards efficient vehicle dynamics evaluation using correlations of objective metrics and subjective assessments. Diss. KTH Royal Institute of Technology, 2015.