OTA 2018 Debrief: Parameter Analysis
2019/08/22 update: this article is part of a series on on-centre vehicle handling using linear system analysis. For further reading, please feel free to check out my other posts:
Welcome to the Ontario Time Attack debrief files, a series of articles where we answer vehicle dynamics questions we always wanted to ask, but could not tackle during the racing season. In this concluding article of the series, we investigate how to improve handling performance by understanding its sensitivities to vehicle properties.
Asking What-if?
Our goal is to use vehicle simulation to better understand vehicle handling. This particular vehicle simulation will help us identify the axle of interest in order to achieve some transient handling specification. Being equipped with this knowledge allows us focus on the most relevant changes and guide decisions on how to set-up the chassis for success.
Simulation is advantageous because it predicts the outcome of a hypothetical change in vehicle configuration. We can ask ‘what-if?’ with regards to vehicle handling and determine which changes have the biggest impact on primary handling metrics.
Baseline Vehicle
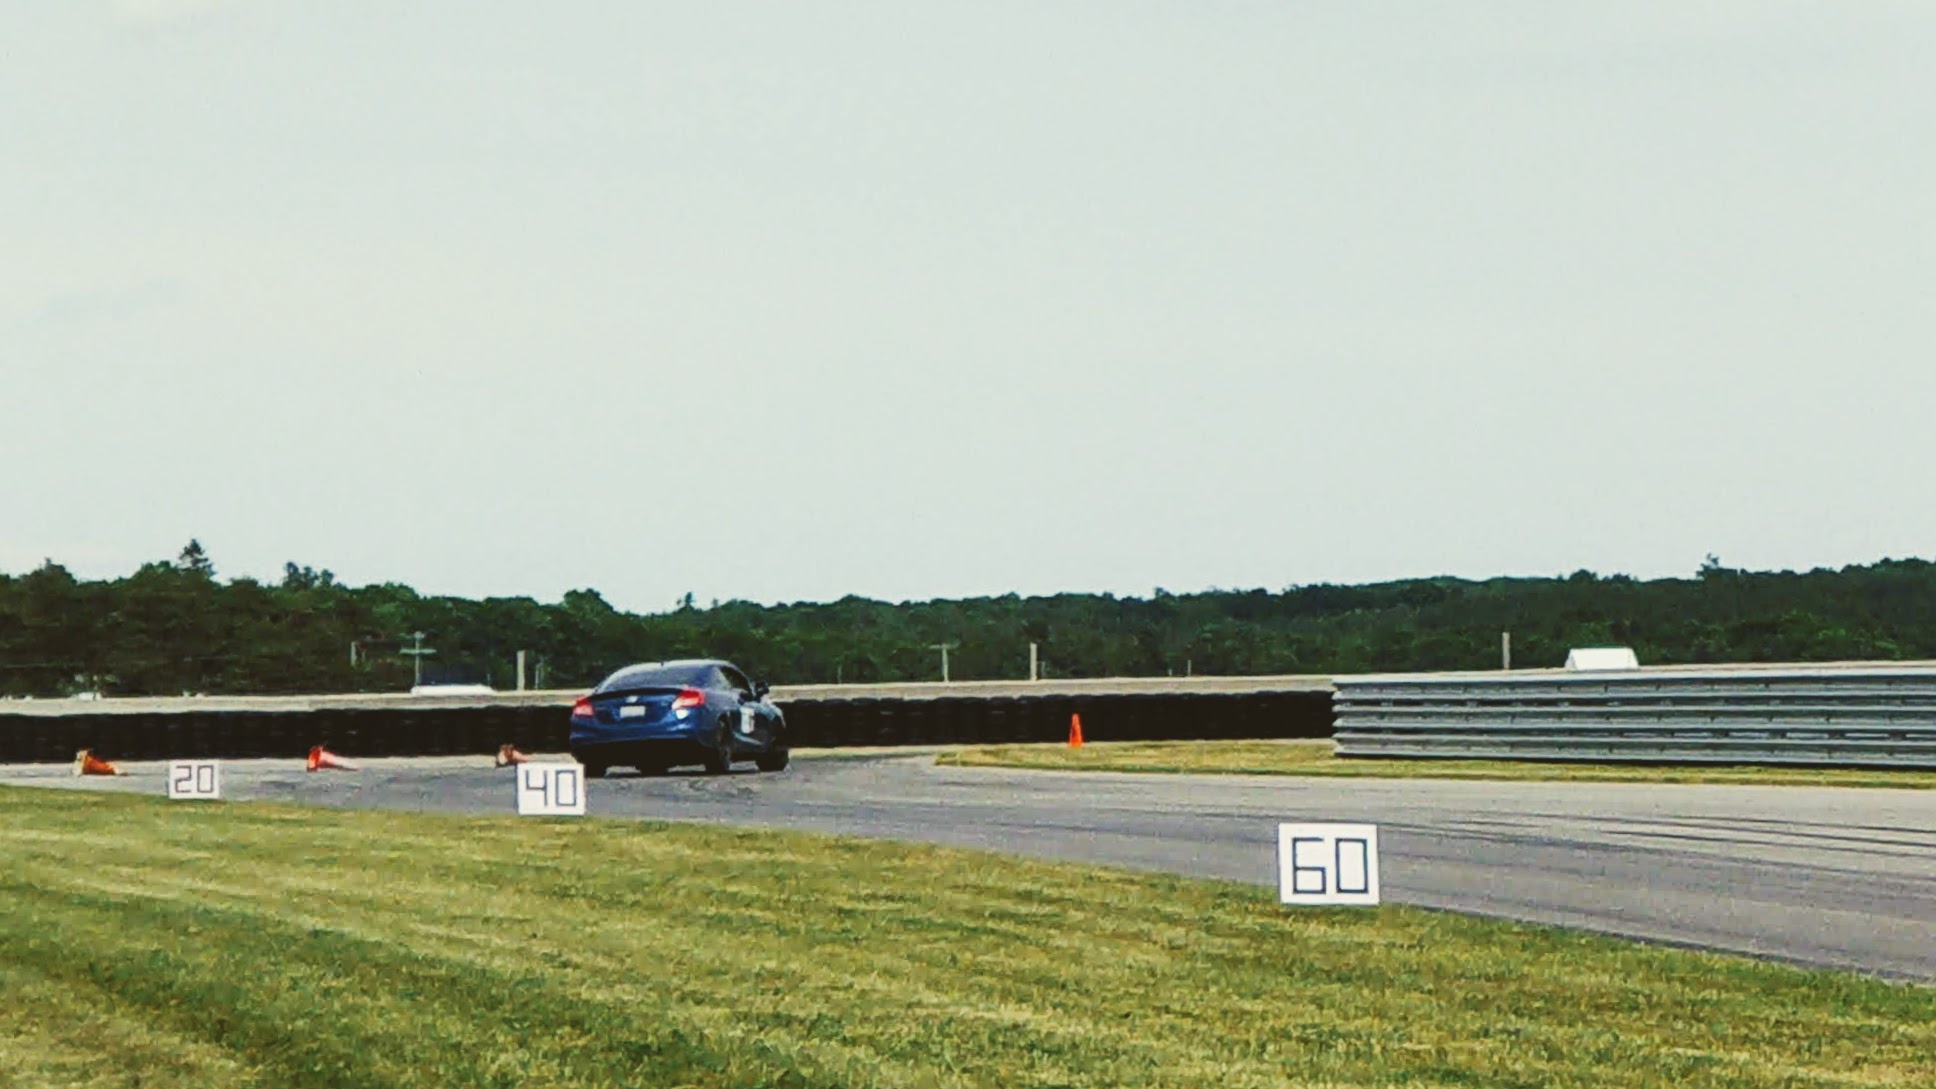
We are evaluating the #551 2012 Honda Civic Si for its on-centre handling sensitivities. The analysis will focus on two parameters: rear cornering compliance and understeer gradient. This is to evaluate the impact of a suspension modification or setup change.
The following parameters are used to represent the baseline vehicle:
| Symbol | Value | Unit | Description |
|---|---|---|---|
| \(a\) | 0.996 | m | Distance from CG to front axle |
| \(b\) | 1.624 | m | Distance from CG to rear axle |
| \(m\) | 1450 | kg | Vehicle mass |
| \(I\) | 2345 | kg m2 | Vehicle yaw inertia |
| \(K\) | 5.5 | deg/g | Understeer Gradient |
| \(D_r\) | 4.1 | deg/g | Cornering compliance, rear |
| \(N\) | 16.08 | - | Steering ratio |
Steering Sensitivity
The analysis begins with steady-state steering sensitivities. The linear single-track vehicle model contains parameters with real-world meaning; for example, vehicle mass and yaw inertia. Analytical evaluation lets us understand underlying relationships from the equations-of-motion in terms of vehicle parameters.
The steady-state steering sensitivity is represented by the DC gain of the transfer functions representing the vehicle lateral dynamics. Studying these sensitivities provides a cursory understanding of the relationship between speed, cornering compliance and the lateral dynamics. The steady-state steering sensitivities are shown below:
\[\frac{R}{\delta} \bigg\rvert_{ss} = \frac{gu}{(D_f - D_r)u^2 + (a + b) g}\] \[\frac{\beta}{\delta} \bigg\rvert_{ss} = \frac{-D_r u^2 + g b}{(D_f - D_r)u^2 + (a + b) g}\]The steering sensitivities share the same denominator whereby the velocity-squared component is governed by the understeer gradient plus a constant based on the vehicle wheelbase. The numerator of the yaw rate steering sensitivity is largely governed by velocity. The chassis slip angle steering sensitivity is more nuanced, with its numerator containing a rear cornering compliance velocity-squared component plus a constant based on weight distribution.
That is a lot to interpret! Let us simplify these equations by only looking at tunable parameters. These parameters are speed, front and rear cornering compliance. Let \(c\) represent some constant value.
\[\frac{R}{\delta} \bigg\rvert_{ss} \propto \frac{u}{Ku^2 + c_1}\] \[\frac{\beta}{\delta} \bigg\rvert_{ss} \propto \frac{-D_r u^2 + c_2}{Ku^2 + c_1}\]The presence of the understeer gradient multiplied by velocity-squared in the denominator is significant because it shows the decaying effect with speed is controlled by the understeer gradient.
For the yaw rate steering sensitivity, if the understeer gradient is small, the yaw rate sensitivity will be dominated by its linear dependence on speed.
The chassis slip angle steering sensitivity is more complicated. The speed effect of the numerator is governed by the rear cornering compliance. The existence of the tangent speed is also observable; there exists a positive value of \(u\) that will result in a zero steady-state chassis slip angle steering sensitivity.
This is not new to our analysis; we have discussed this in our on-centre vehicle handling assessment. In case you forgot, here are the results showing the effect of speed on the steering sensitivity.
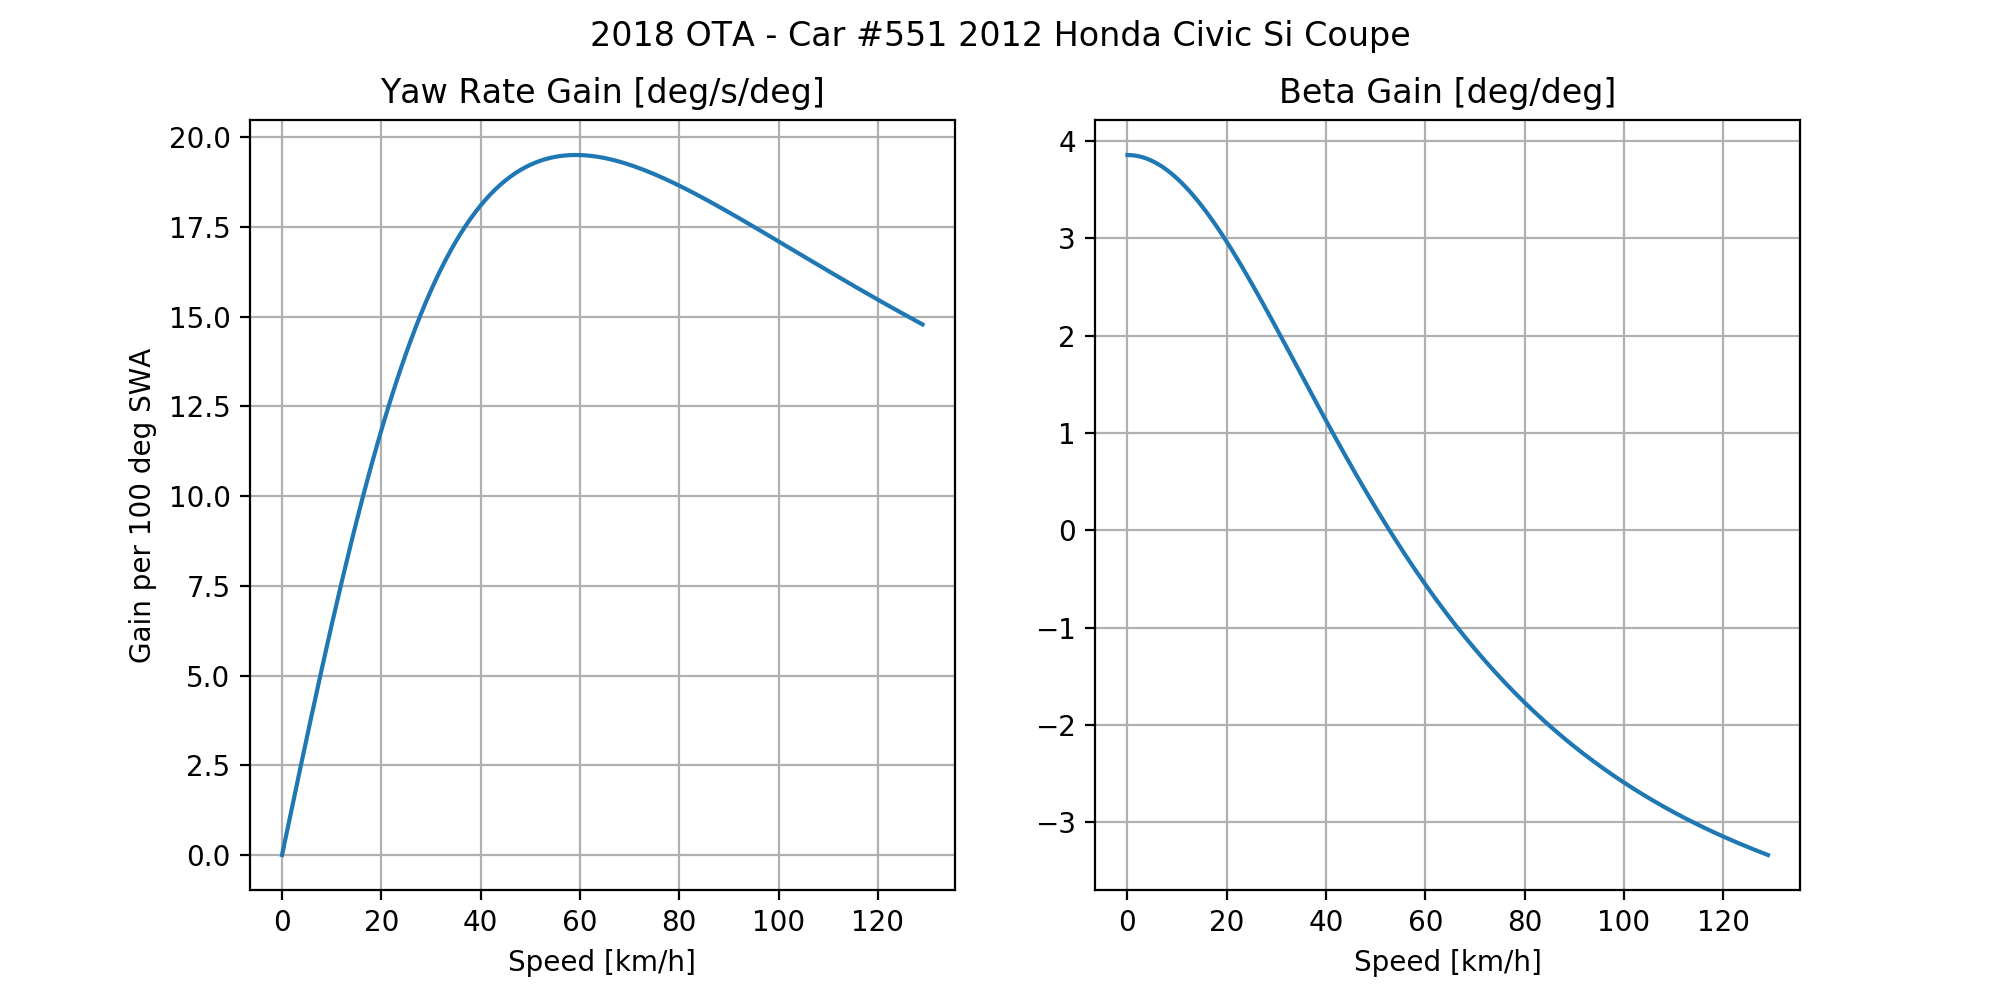
The yaw rate steering sensitivity is primarily dominated by the linear velocity term in the numerator below 60 km/h. As the velocity exceeds 60 km/h, the yaw rate steering sensitivity begins to decay.
It is noteworthy to mention that the steady-state chassis slip angle gain approaches a limit as \(u \rightarrow \infty\).
\[\lim_{u\rightarrow\infty}\frac{\beta}{\delta} \bigg\rvert_{ss} = \frac{-D_r}{K}\]Interestingly, this vehicle experiences a decay in its steering sensitivity near its tangent speed. The driver has had success with this vehicle in an autocross setting, but encountered difficulties on a road course. This observation is likely attributable to this effect.
Transient Trade-offs
Good vehicle handling is ultimately an amalgamation of transient and steady-state handling factors. Previously, we discussed the use of handling metrics to quantify the handling response. By running a successive set of simulations with a parameter sweep of rear cornering compliance and understeer gradient, we can observe the handling landscape for a set of different vehicle configurations.
To understand the relationship between vehicle setup, directional response and stability, we can use a carpet plot to demonstrate the existence of a handling map.
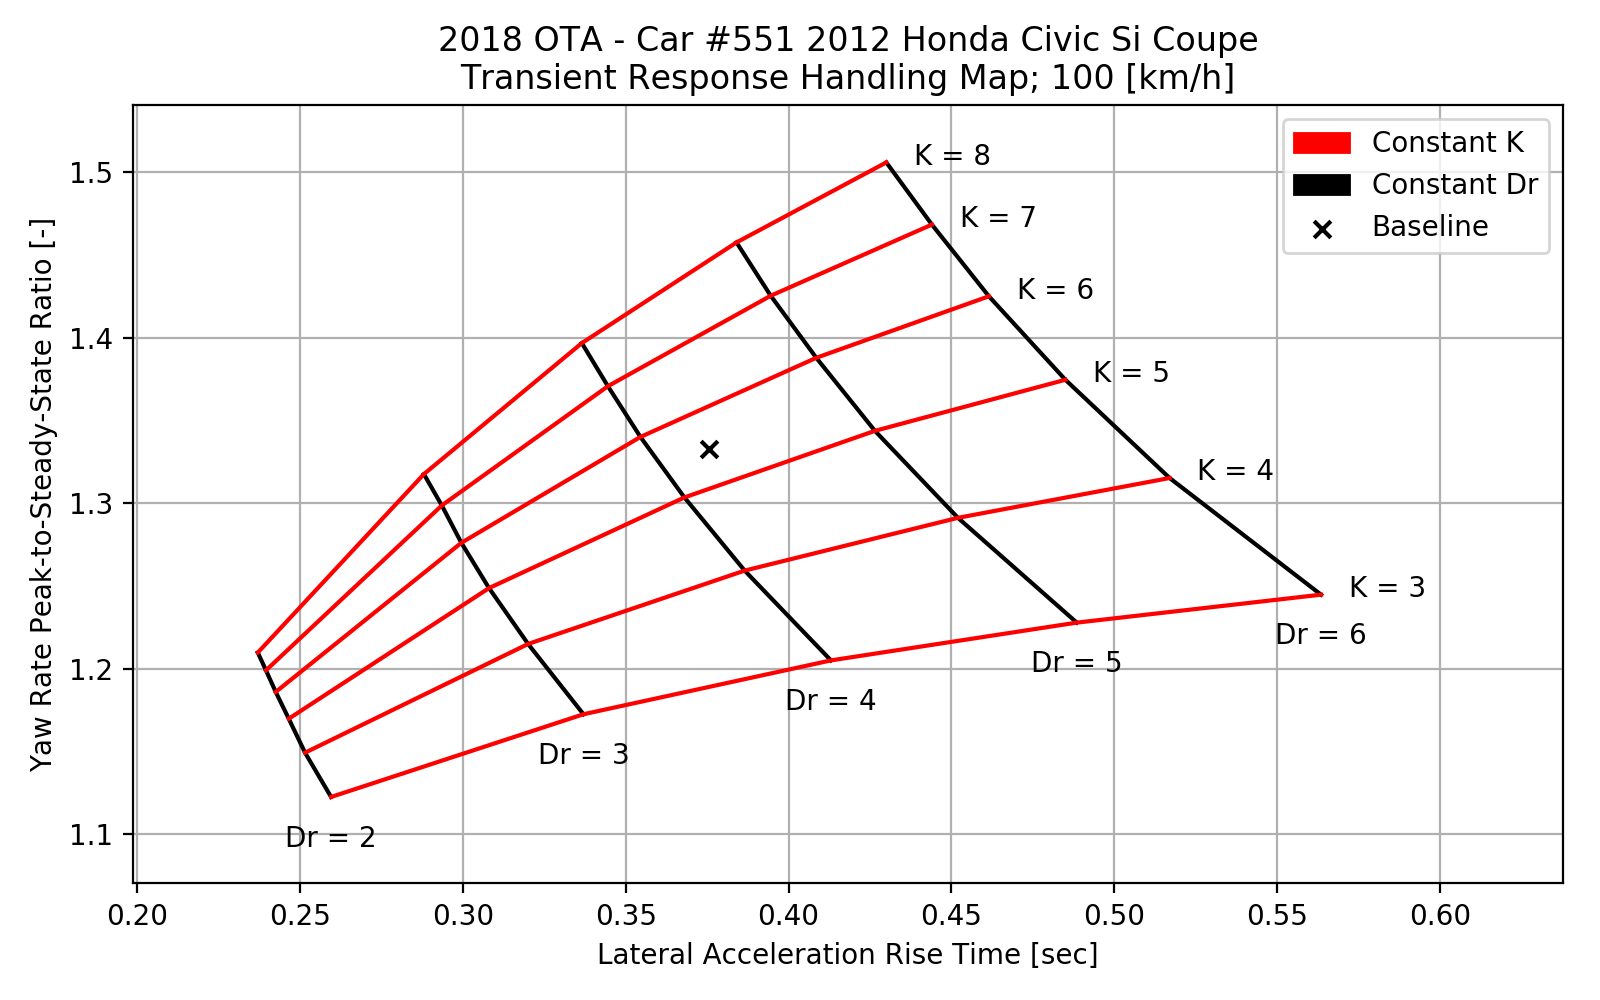
In this specific example, yaw rate peak-to-steady-state ratio (effectively yaw overshoot) is plotted against the lateral acceleration rise time. The yaw rate peak-to-steady-state ratio is used as a measure of stability, and the lateral acceleration rise time is used as a measure of directional response. We define ‘good handling’ as a yaw rate peak-to-steady-state ratio near a value of 1 and a lateral acceleration rise time near a value of zero to indicate faster directional response.
The decision to work on the rear cornering compliance or on the understeer gradient is not trivial. Reducing the rear cornering compliance for a given understeer gradient has the effect of reducing the lateral acceleration rise time and reducing the yaw overshoot. Reducing the understeer gradient for a given rear cornering compliance is more effective at reducing the yaw overshoot but at the expense of increasing the lateral acceleration rise time.
Improving both the lateral acceleration rise time whilst reducing the yaw overshoot requires modification of both rear cornering compliance and understeer gradient. For example, lets say we want to achieve the response achieved with a rear cornering compliance of 4 deg/g and understeer gradient of 5 deg/g.
| Parameter | Baseline | Modification | % Change |
|---|---|---|---|
| Understeer Gradient, \(K\) [deg/g] | 5.5 | 5.0 | -10.0% |
| Rear Cornering Compliance, \(D_r\) [deg/g] | 4.1 | 4.0 | -2.4% |
| Lateral Accel. Rise Time [sec] | 0.376 | 0.368 | -2.1% |
| Yaw Rate Overshoot [%] | 33.3% | 30.3% | -9.0% |
By reducing the understeer gradient by 10% and reducing the rear cornering compliance by 2.4%, we are able to reduce the yaw overshoot by 9% and the lateral acceleration rise time by approximately 2%. Achieving these results in real life is not outside the realm of possibility; this change is small on a percentage basis and may be achievable with a setup change!
Setup Selection
The relationship between response and stability is complicated. To determine which axle to place our efforts on, we emphasize the relationship between the rear cornering compliance, understeer gradient and front cornering compliance.
In the following example, the impact of front cornering compliance, understeer gradient and rear cornering compliance on lateral acceleration rise time is visualized in a carpet plot.
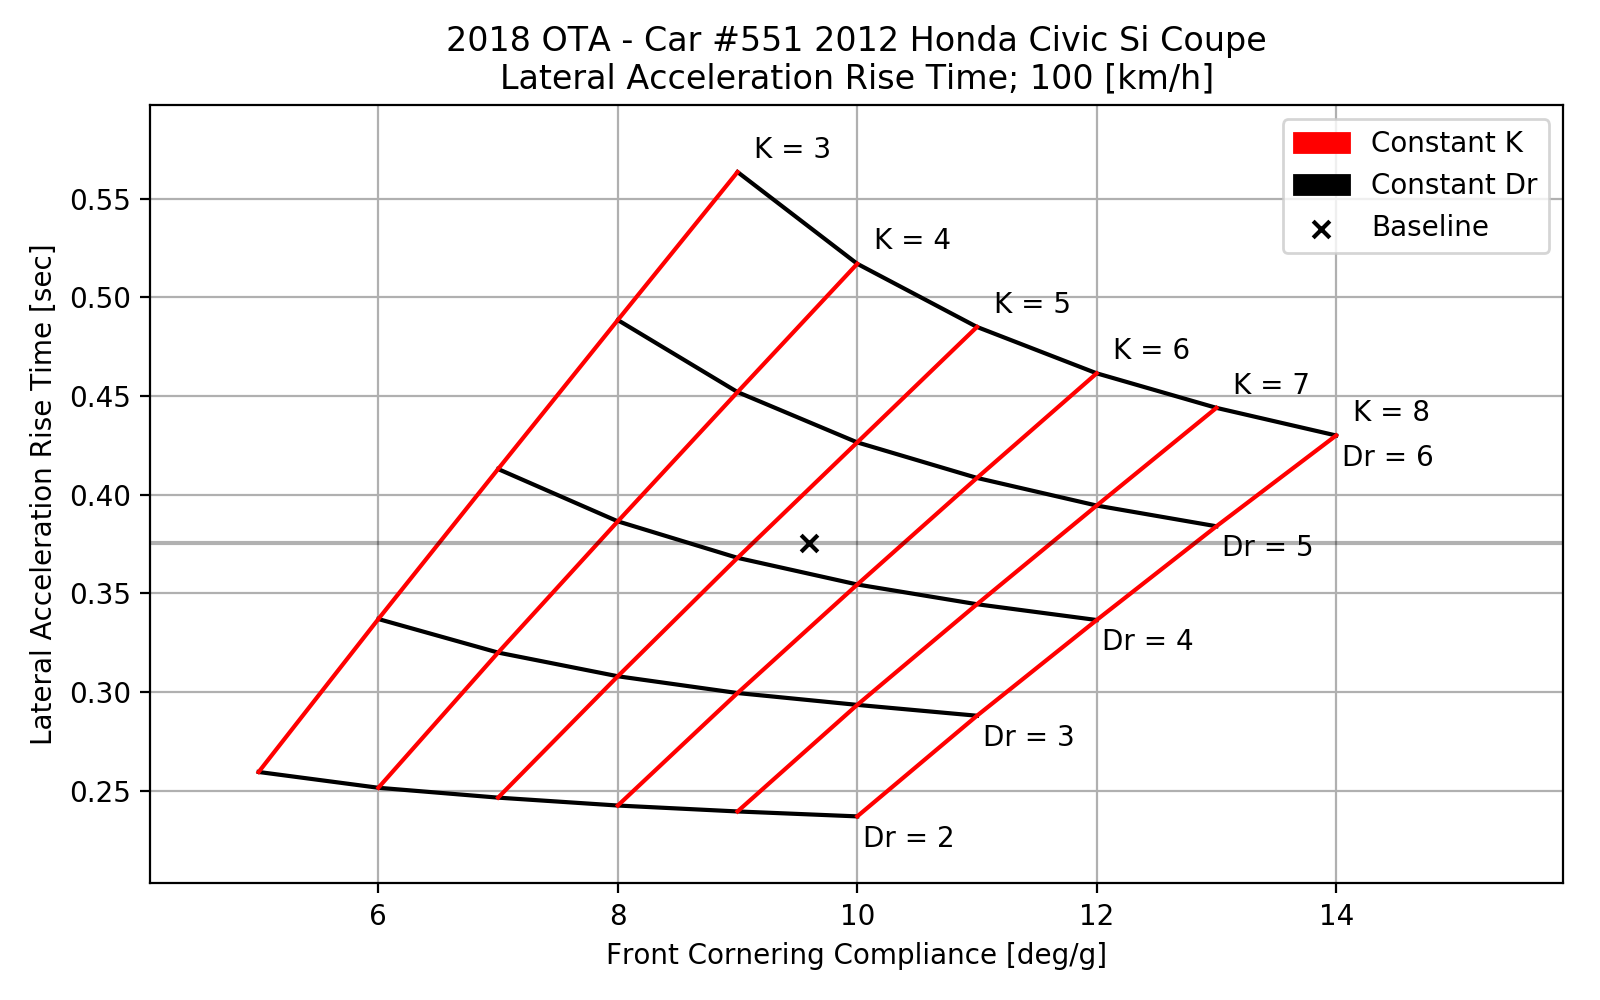
The rear cornering compliance and the understeer gradient are represented by the constant condition isolines. The inclusion of the front cornering compliance on the x-axis emphasizes the definition of the understeer gradient; a constant front cornering compliance condition is represented by a vertical bar. Observe how the intersection of the isolines align with the x-axis gridlines.
In the previous example, we chose to target a \(K\) of 5 deg/g and a \(D_r\) of 4 deg/g. If the goal is to reduce the lateral acceleration response time, it would be more effective to keep the front cornering compliance constant and reduce the rear cornering compliance.
Notice that there are multiple solutions to achieving a given lateral acceleration rise time target. A vehicle with a \(K\) of 8 deg/g and a \(D_r\) of 4 deg/g will have a similar lateral acceleration rise time to a vehicle with a \(K\) of 4 deg/g and a \(D_r\) of 3 deg/g. The baseline lateral acceleration rise time performance can be met even if the understeer gradient is increased.
Asking Now-what?
Reflecting back on the 2018 OTA season, the driver of the #551 2012 Honda Civic Si Coupe struggled with the following:
- Difficulty inducing vehicle rotation at turn-in
- Sluggish directional response at corner-entry
- Conservative mid-corner vehicle placement
Some of these experiences can be explained via the open-loop on-centre vehicle response. The steering sensitivity drops off at the speeds of most road courses in the area. This explains the general difficulty with initiating turn-in and corner-entry. The lack of stability at corner-entry may consequently affect mid-corner. It is likely the driver is approaching the mid-corner with caution due to the lack of stability at corner-entry.
Given the driver feedback, it may be beneficial to increase the steering sensitivity at competition speeds and to reduce the yaw velocity overshoot. The handling map shows the yaw velocity overshoot and yaw rate steering sensitivity is primarily influenced by the understeer gradient. The immediate suggestion for the #551 2012 Honda Civic Si Coupe would be to work on the front cornering compliance to reduce the overall understeer gradient of the vehicle.
From a practical vehicle modification standpoint, the following recommendations were made for the #551 2012 Honda Civic Si:
- Reconsider the choice of corner spring rates for the front and rear axles
- The findings from the analysis directly prompted an investigation into the spring rates
- Consider different tire constructions or compounds for the front/rear axles to achieve the desired understeer gradient
- Use tuning parameters (ex. tire pressure, damper settings) to make slight adjustments and to provide additional stability for driver confidence
Further simulations can be run to assess more specific areas of concern. It may be valuable for the driver to see a simulated response such that they can better anticipate and control the vehicle.
Some Caveats
As we conclude our analysis for the season debrief, it is important to reflect on the questions we answered - but also the questions we did not answer.
The linear single-track vehicle model, as the name implies, has two major defining characteristics: linear and single-track. These simplifying assumptions puts limits on the type of conclusions we can draw from simulation.
It can be argued that linear analysis is less relevant to motorsport applications because the non-linearities primarily introduced by tire force/moment generation will give rise to a performance envelope.
Generally speaking, most road vehicles are four-wheeled. The single-track vehicle model does not consider track width and consequently does not include a roll degree of freedom. Load transfer effects are not directly included in the analysis.
The cornering compliance method (also known as Bundorf analysis) is a lumped-parameter analysis. Given just the front and rear cornering compliances, as we have done in our examples, does not detail the contributing mechanisms to the cornering compliances.
Last but not least, we must always look at simulation results with a grain of salt. Modelling and simulation represents our assumptions about how the world is governed, but it is not a compete representation of reality. We recognize that the results shown here may not be accurate, but we value the insight it can bring more than the absolute numerical output of our work.
Concluding Remarks
Our study of the #551 2012 Honda Civic Si Couple covered many topics. The understeer gradient test and pulse steer test represents our foray into experimental vehicle dynamics. Vehicle modelling and simulation represented our efforts into analytical vehicle dynamics and computational techniques, and we used this to evaluate vehicle handling and study vehicle sensitivities.
This analysis is in direct inspiration of the historic works in vehicle dynamics. The analysis methods we have used are based on 40+ years of automotive research: Olley at Cadillac with the definition of understeer in 1934, Whitcomb and Milliken at Cornell Aeronautical Labs (CAL) with the equations of motion for the linear single-track bicycle in 1956, and Bundorf and Leffert at General Motors with the cornering compliance concept in 1976.
There are striking similarities between the historic research and the curiosity of today’s amateur racing driver. The constraints of limited information are challenges we still have today. However, modern technology gives us an advantage that our predecessors did not.
It is through this work we recognize the similarities and demonstrate the immense knowledge and value to be had studying these foundational works.
Acknowledgements
The following individuals and organizations have helped contribute to the OTA Debrief series:
- Joseph Yang and his #551 2012 Honda Civic Si. This analysis would not be possible without his collaboration;
- Ping Zhang at Apex Performance Engineering - follow us on Facebook!;
- CASC-OR, Ontario Time Attack and the community for their support
References
- Milliken, William F., and Douglas L. Milliken. Race car vehicle dynamics. Vol. 400. Warrendale: Society of Automotive Engineers, 1995.
- Bundorf, R. Thomas, and Ronald L. Leffert. The cornering compliance concept for description of vehicle directional control properties. No. 760713. SAE Technical Paper, 1976.
- Testing, Testing 1,2 …” FSAE.com, 2015, www.fsae.com/forums/showthread.php?12204-Testing-Testing-1-2-…
- Milliken, William F. “Maurice Olley.” Milliken Research Associates. SAE Automotive Dynamics and Stability Conference, Mar. 2019, Troy, Michigan, www.millikenresearch.com/MauriceOlleybyWFMilliken.pdf.