Measuring the effect of inflation pressure, inclination angle and vertical load on static contact patch shape of a 255/40R17 ultra-high performance 200TW tire - Bridgestone Potenza RE-71R
The tire contact patch is a critical area of study in vehicle dynamics. The forces generated at the contact patch are responsible for the vehicle’s handling and control properties. This phenomenon underpins the foundations of vehicle dynamics.
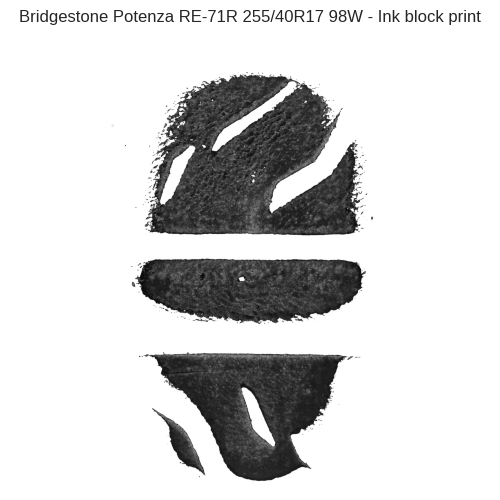
The tire contact patch can be visualized using empirical measurement techniques. The simplest method is to take an ink block print where the resultant tire footprint can then be analyzed.
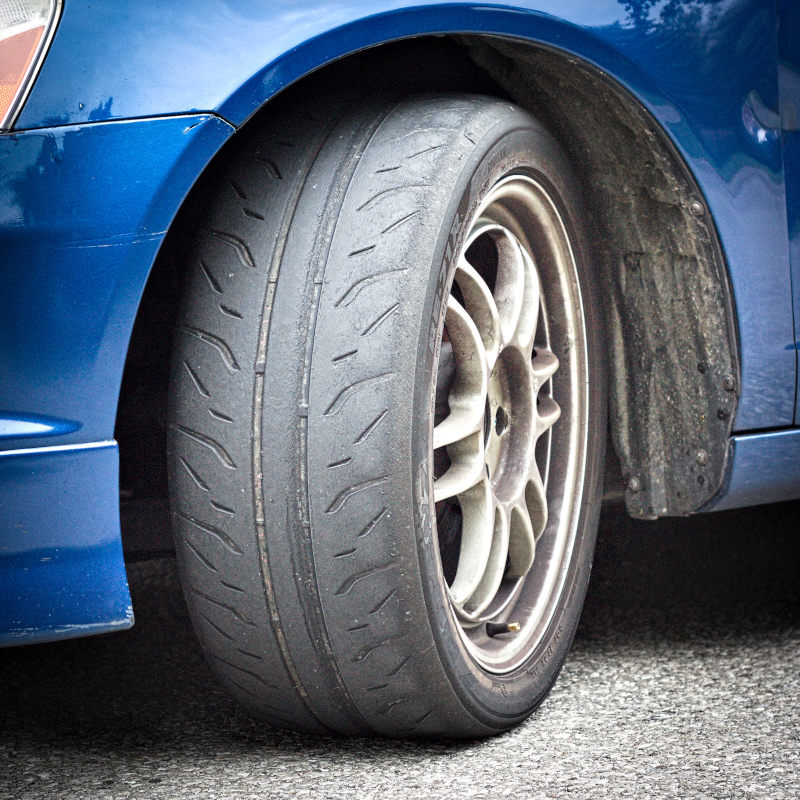
In this study, we will look at the static contact patch shape of a used Bridgestone Potenza RE-71R 255/40R17 98W tire using ink blocking techniques. The contact patch shape evolution under the influence of inflation pressure, inclination angle and vertical load is explored.
Tire footprints
Contact patch visualization allows for its length, width and contact area to be analyzed. A simple visualization technique is to take an block print. This involves making an impression of the tire over a flat surface, much like pressing a rubber stamp against a medium to create an impression. The industry standard ASTM F870 defines the steps to perform this visualization using ink. Although contact patch visualization is primarily used for tire research, we can apply the same concepts from literature to observe trends in the ultra-high performance tire segment.
The ink block prints are obtained using a static tire testing fixture. Designed and built by Formula Delta, the tire testing fixture allows ink block prints to be taken under controlled inflation pressure, inclination angle and vertical load. The capabilities of the test fixture is shown in the table below.
| Parameter | Value |
|---|---|
| Vertical load, max [N] | -6675 |
| Loaded radius, max [mm] | 375 |
| Tire width, max [mm] | 400 |
| Inclination angle [deg] | 0, 2, 4 |
| Bolt pattern | 5x114 |
Long-time followers may be familiar with this technique from Choosing Tire Pressure using Static Contact Patch Measurements. In this iteration, the study makes use of the test fixture to add inclination angle and vertical load as inputs to the study.
Test schedule
The tire under test is a used Bridgestone Potenza RE-71R 255/40R17 98W with a date of manufacture of September 2018. The measured tread depth is 4.5 mm. Ambient temperature is measured at 17 °C. The tire is mounted on a 9 inch wide rim.
The test matrix consists of five inflation pressures, three inclination angles and five vertical loads. The test conditions are summarized in the table below.
| Test condition | Value |
|---|---|
| Inflation pressure [PSI] | 24, 27, 30, 33, 36 |
| Inclination angle [deg] | 0, 2, 4 |
| Vertical load [lbs] | -500, -800, -1000, -1200, -1400 |
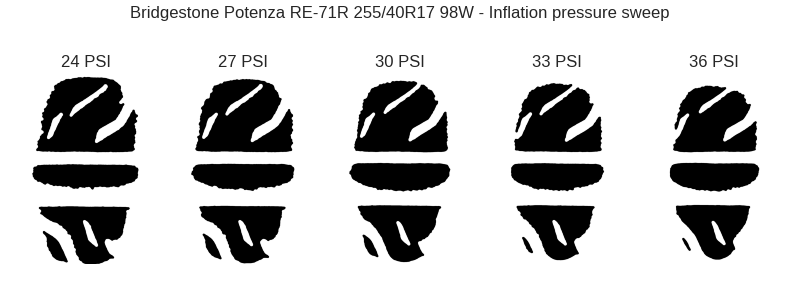
A wide range of inflation pressures are selected to reflect the needs of different cars. A set of footprints are presented to demonstrate the influence of inflation pressure.
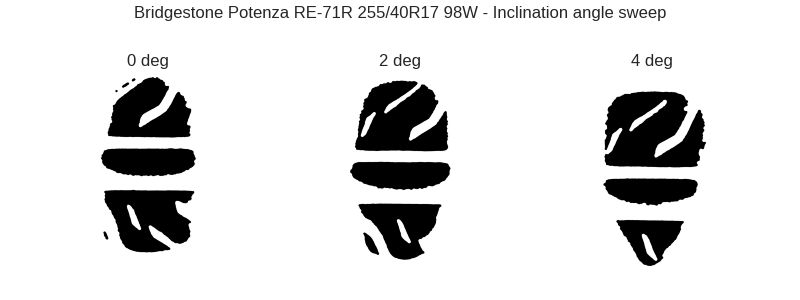
The choice of inclination angle is fixed given the capabilities of the test fixture. You can see the effect of inclination angle in the footprints shown below.
To focus the study in the most interesting operating regions of the tire, we choose a set of vertical loads near the maximum testing limit. Vertical loads from -1400 lbs to -800 lbs are tested in 200 lb increments. An additional condition of -500 lbs is added to capture the contact patch phenomenon when the tire is unloaded.
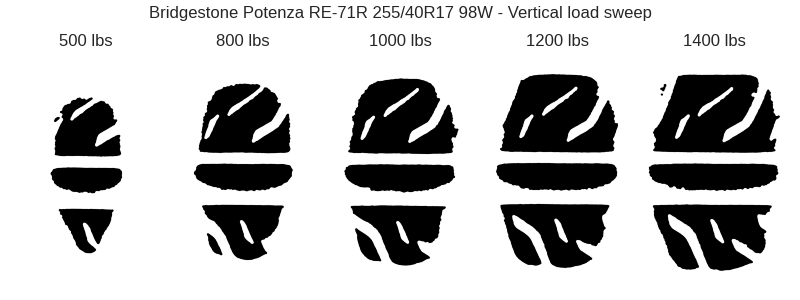
In total, 75 unique ink block prints were obtained for this study.
Analysis
The ink block prints are analyzed using a computer. The footprints are digitized and filtered before being passed through an analysis routine. The measurements extracted from the analysis include the contact patch length, width and area.
Geometry
The simplest property that can be measured from the tire footprint is its geometry. We can gain some insight simply by looking at the contact patch length and width.
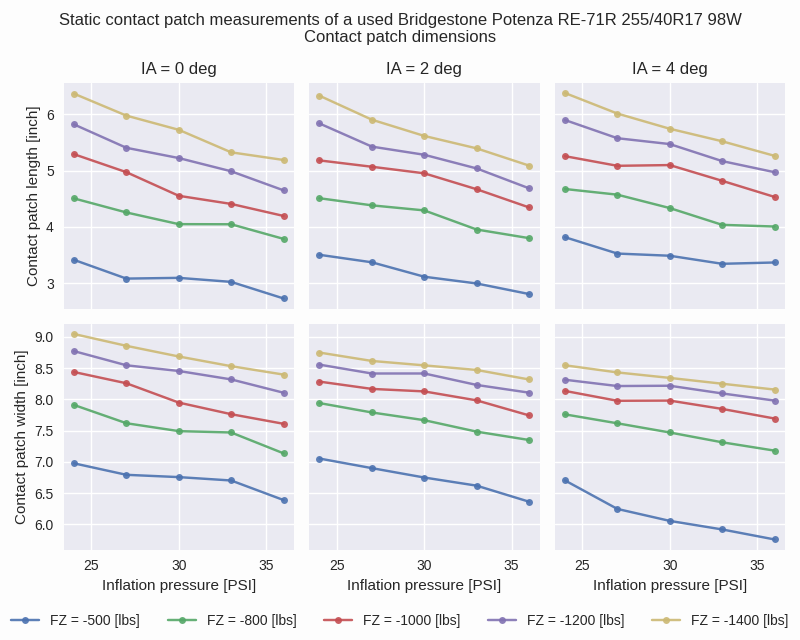
An interesting trend that emerges is the effect of inclination angle on width. At high loads, the contact patch width decreases with inclination angle. At an inclination angle for 4 deg and a vertical load of -500 lbs, the contact patch is lengthened but the width is shortened. This is because the full width of the tire no longer engaged with the road surface.
Contact area
In this study, the gross contact area is the area of a convex hull that encircles the tire footprint. Within this convex hull, the area that is not in contact with the road is the void area. The void ratio can be computed as the ratio between the void area and the gross contact area.
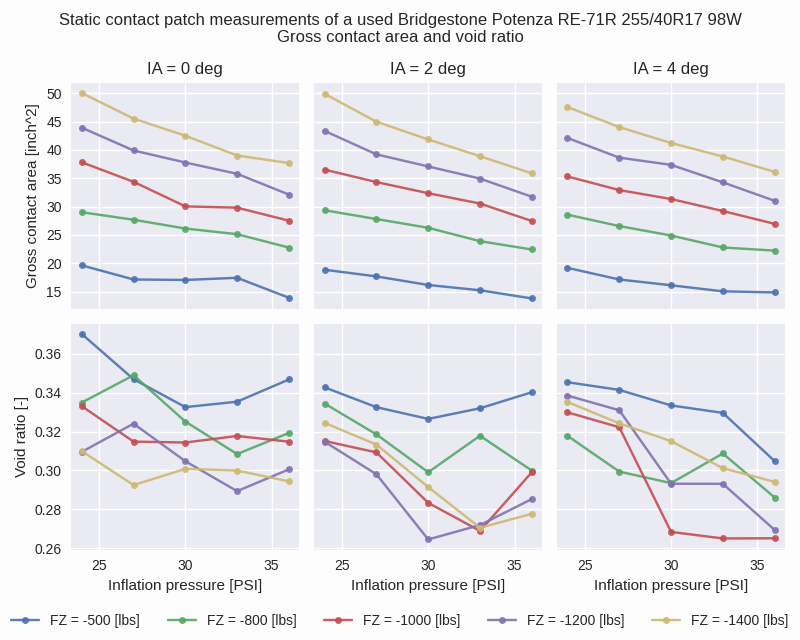
The trend with inflation pressure is similar across inclination angles. The gross contact area trends down as the inclination angle is increased though the effect is subtle in these graphs. This is most pronounced at 4 deg of inclination angle.
The void ratio charts are a mess, though it does suggest that the tire tread pattern is designed to achieve a desired range of void ratios. The void ratio can vary from 0.26 to 0.37 with a mean of 0.31 across all conditions.
Aspect ratio
In this analysis, the contact patch aspect ratio is defined as the ratio between the contact patch length and width. This characterizes the shape of the contact patch. A 1:1 aspect ratio indicates a square contact patch shape in the sense that the width is equal to its length.
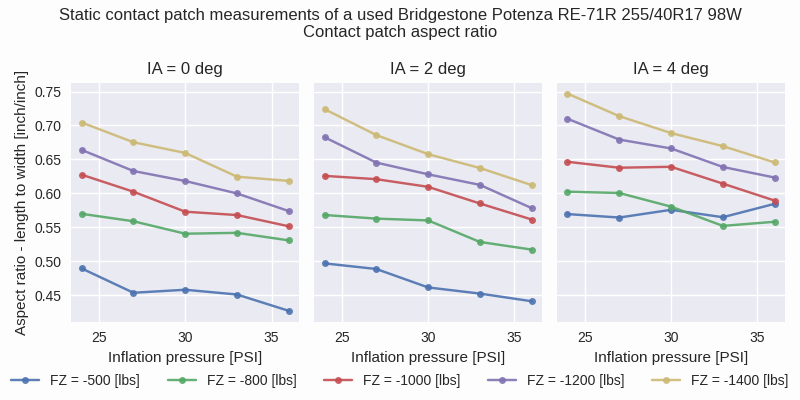
The most interesting finding is how the aspect ratio is changing at 4 degrees of inclination angle. The effect of the tire lifting off the ground can be observed at 4 deg inclination angle and -500 lbs of vertical load, just as we observed in the footprint geometry.
Load sensitivity
Tire are known to be load sensitive. This phenomenon can be explored in the context of contact patch shape and size. The heat map below shows the load sensitivity of the contact patch length, width and gross area, averaged by inflation pressure.
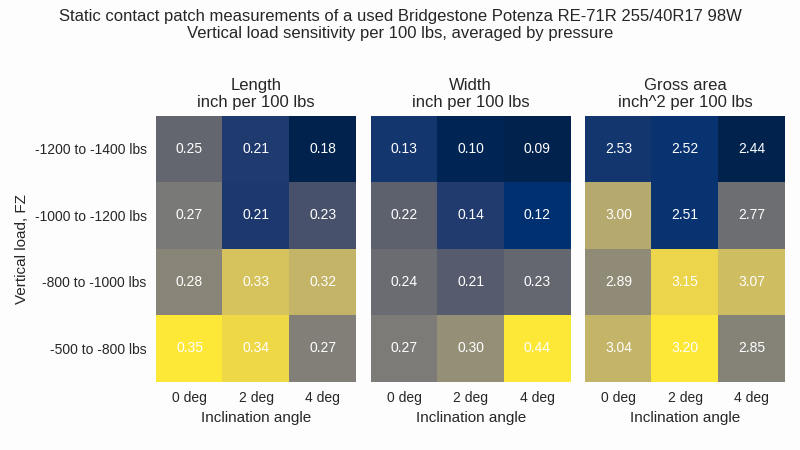
Of the three sensitivities presented, the contact patch width has the clearest trend where the change per 100 lbs of vertical load is reduced as the load is increased. This is more pronounced as inclination angle is increased. Load sensitivity is less clear in the contact patch length and gross area, though it can be argued that some distinction can be made between high loads and low loads.
Final comments
The relationship between the tire contact patch shape versus inflation pressure, inclination angle and vertical load is complex. In the case of the Bridgestone Potenza RE-71R 255/40R17 98W, the contact patch becomes distorted at high inclination angles as the full width of the tire is no longer in contact with the ground. Inflation pressure tends to decrease the gross contact area and is more pronounced at high vertical loads. A load sensitivity effect is observed in the contact patch shape.
Tires are sophisticated engineered products designed to handle the extreme conditions demanded by modern road vehicles. The tire contact patch is the vehicle’s interface with the ground and is responsible for generating forces that affect handling and control. Gaining insight into this phenomenon represents an advantage in chassis design and setup. Static laboratory tests provide unique insight that subjective on-track testing alone cannot. As lab tests are controlled and repeatable, it is a unique way to compare tires before the rubber meets the road.
Acknowledgements
This analysis is possible thanks to Ping Zhang at Formula Delta. You can learn more about Formula Delta on Facebook and Instagram.
References
- Gent, A. N., & Walter, J. D. (2006). Pneumatic tire. National highway traffic safety administration.
- Gillespie, T. D. (1992). Fundamentals of vehicle dynamics (Vol. 400). Warrendale, PA: Society of automotive engineers.
- Wong, J. Y. (2001). Theory of Ground Vehicles. John Wiley & Sons.
- “ASTM F870 - 94(2016).” ASTM International - Standards Worldwide. https://www.astm.org/Standards/F870.htm.